Reducing the internal diameter of your HPLC columns is an advantage for electrospray (ESI) LC/MS users. To understand this, two characteristics of ESI must be understood: (1) how response (i.e., peak area or height), is related to analyte concentration and (2) how response varies with HPLC flow rate.
Electrospray is a Concentration-Dependent Detector
Analytical detection systems work as either mass-dependent or concentration-dependent detectors. In a mass-dependent system the response of the detector will increase as we increase the absolute amount of analyte entering the detector. In contrast, for a concentration-dependent detector, increased signal requires an increase in the concentration of the sample being introduced. Ikonomu, Blades and Kebarle published their observations on the concentration-dependency of electrospray in 1991:
The mass analysed ion signal for an ionic analyte increases proportionately to the analyte ion concentration in solution from 10-9 M (detection limit) to 10-5 M. This linear range lies below the concentration of electrolyte impurities in the solvent (methanol), which is 10-5 M. From 10-5 to 10-4 M, the signal increases with approximately the square root of the concentration; and, at higher molalities, the signal ‘saturates’ and begins to decrease. [1]
Electrospray Response Depends on Flow Rate
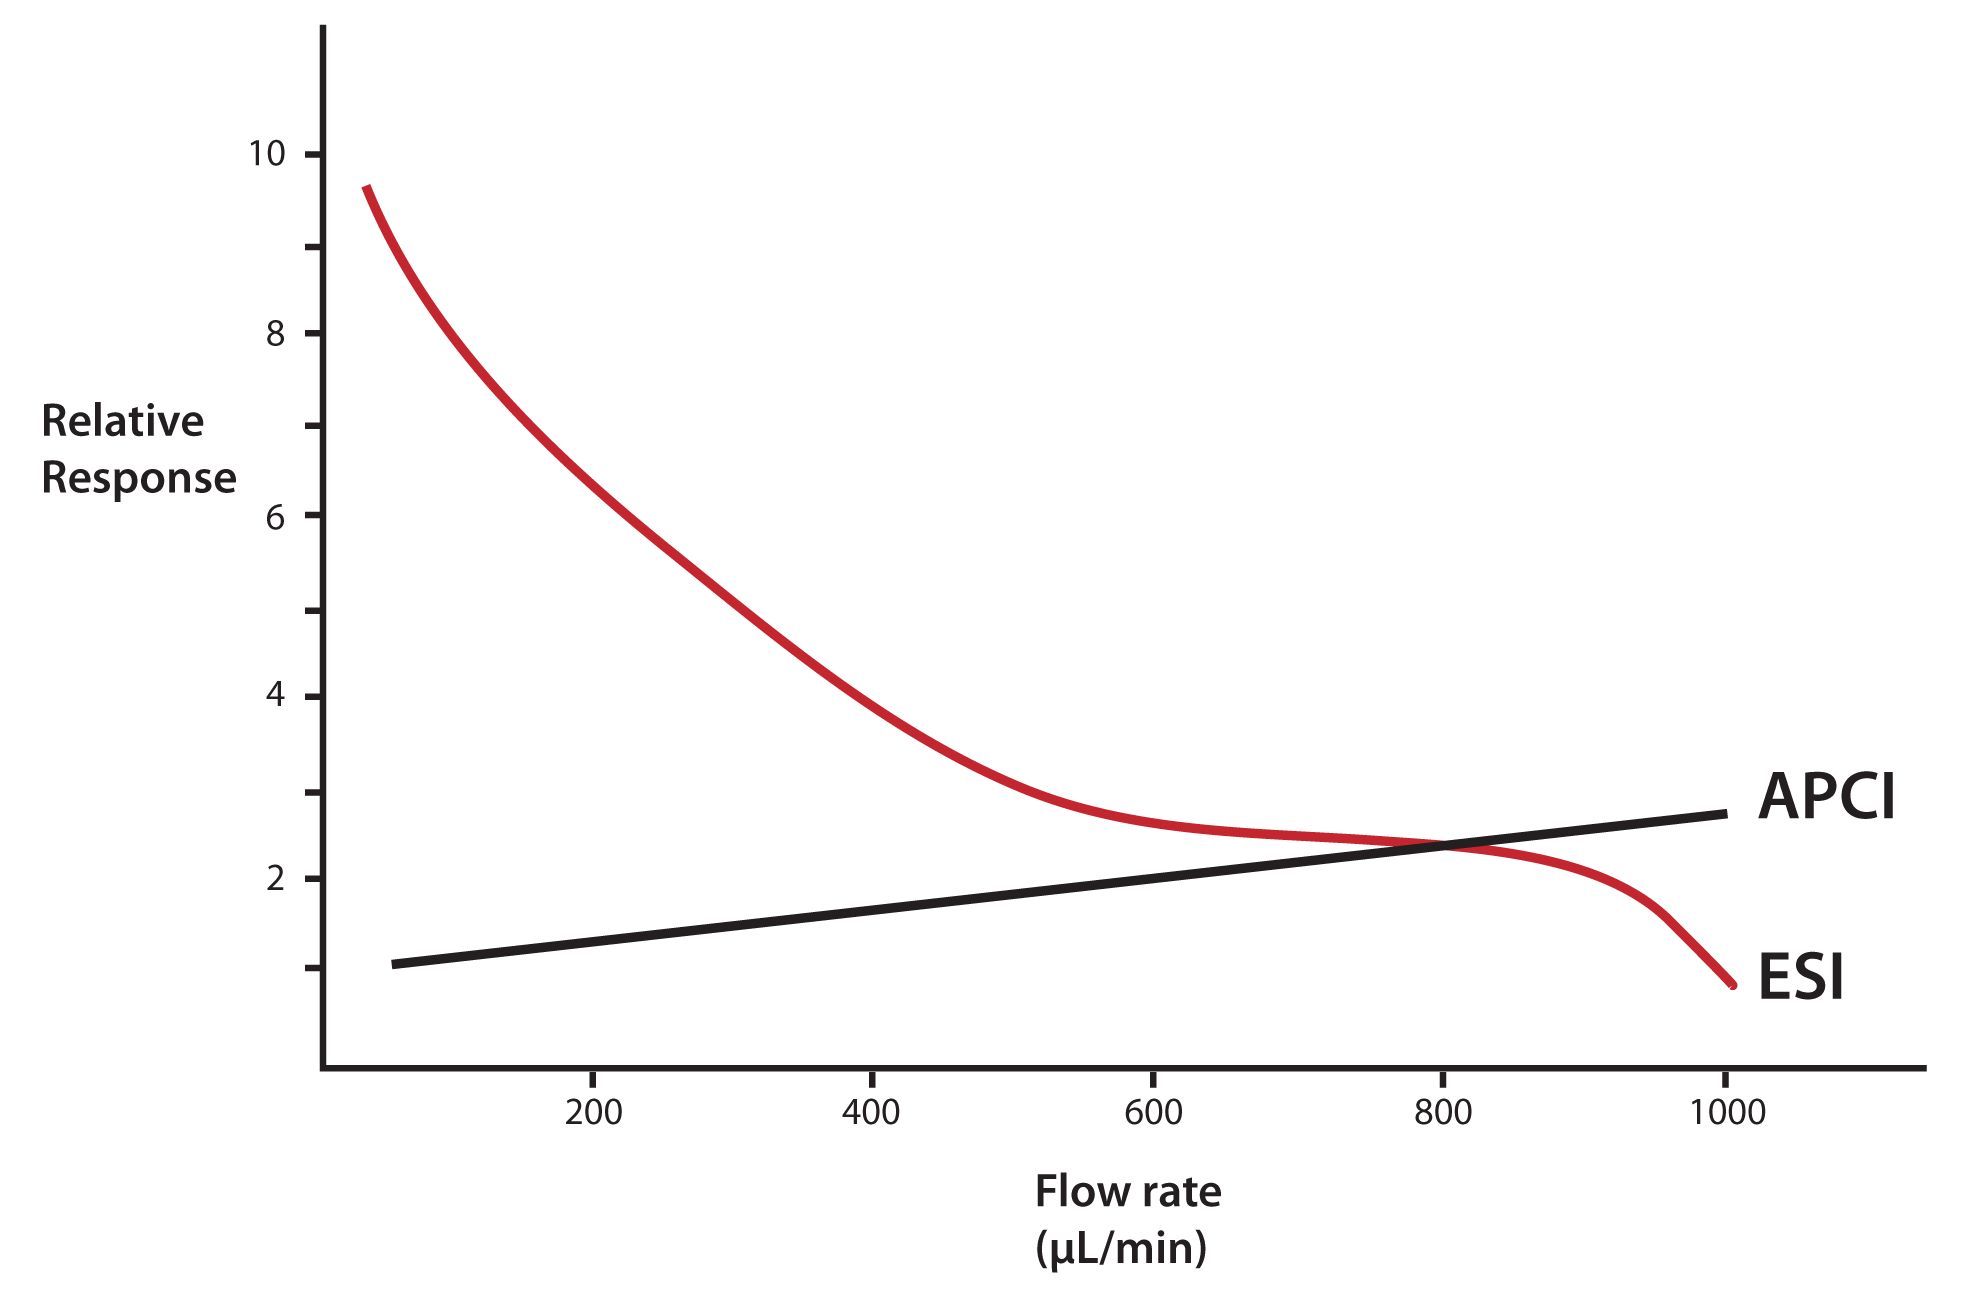
There is a considerable difference in the response of an electrospray detection system as the flow-rate of the incoming HPLC effluent is changed. Referring to Figure 1, we see a tenfold increase in signal in this infusion experiment as the flow-rate of solvent into the interface is decreased from 1 mL/min to 50 μL/min. Atmospheric pressure chemical ionization (APCI), shows very little flow-rate dependency and what little change in response is observed is the opposite of electrospray; i.e., response decreases slightly with decreasing flow rate.
Characteristics of Narrow-Bore HPLC Columns
We have come to think of 4.6-mm internal diameter (ID), HPLC columns as the “standard” analytical column. These columns operate at moderate backpressures and, when coupled with stationary phase particle diameters of 5 μm or less, provide very good separation efficiencies.
Our interest in this article is with “narrow-bore” columns which we will define at 1–2-mm internal diameter columns. These columns can generally be used with standard analytical HPLC systems. The operational characteristics of these columns differ from 4.6-mm columns in several ways which are important for the HPLC user to understand. But the first thing users must understand is what these columns do not do.
Reducing the internal diameter of a gas chromatography (GC) column results in a dramatic improvement in efficiency (number of theoretical plates), and therefore allows for better resolution between closely eluting peaks. The reason for this dramatic improvement in GC with smaller ID columns is reduction in the contribution of radial diffusion (i.e., movement of analyte toward the walls of the column), to band-broadening. In an HPLC column there is virtually no band-broadening from radial diffusion and therefore a narrow-bore column is not inherently more efficient than a 4.6-mm column when packed with the same stationary phase.
Narrow bore columns compared with 4.6-mm columns with the same stationary phase material will:
- Operate at higher backpressures (for the same column length)
- Reduce solvent consumption
- Require a smaller injection volume
- Operate at reduced flow rates
- Exhibit increased ‘in-peak’ analyte concentration
I have italicized the last two points because they tie in directly to the discussion above about operational characteristics of electrospray, namely: The reduced flow rate and increased analyte concentration seen with narrow-bore columns both result in improvements in the signal from electrospray LC/MS.

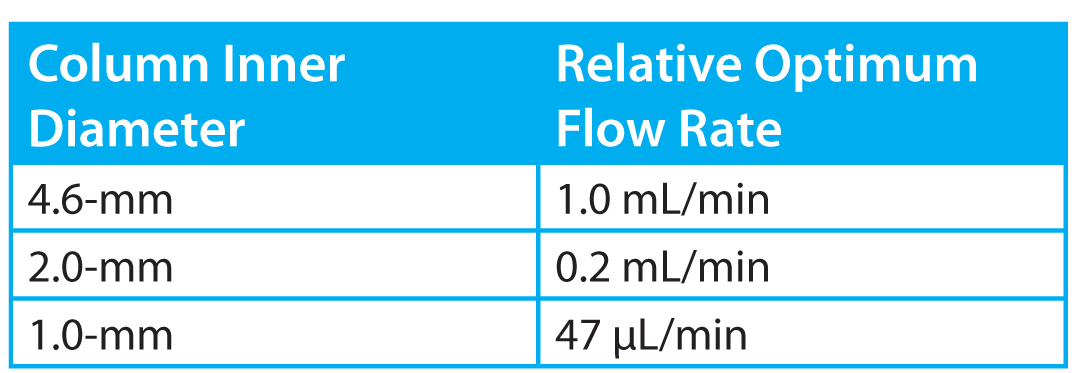
Table 1: The relative flow rate required to maintain an equal linear velocity in columns of varying ID. See the text for further explanation
Determining Optimum Flow Rate for Narrow Bore Columns
An important chromatographic parameter is the velocity of the mobile phase through the column, referred to as linear velocity, symbolized u.
The van Deemter equation tells us that the optimum efficiency (measured as H, height equivalent to a theoretical plate), for a given stationary phase material is found at the optimum mobile phase linear velocity. This optimum value for u is independent of column dimensions.
Linear velocity can be defined in terms of mobile phase flow rate (in mL/min) and column cross-sectional area:
u = flow rate / ∏r2 (Eq. 1)
To maintain the same linear velocity when column ID is reduced, the mobile phase flow rate must be reduced by the inverse square of the column internal radius. (See Table 1)
Combining the numbers in Table 1 with the plot in Figure 1, it appears that simply scaling down our ESI LC/MS method from a 4.6-mm to a 1-mm ID column could result in a tenfold improvement in response from the mass spectrometer!
 Figure 1: Change in response with incoming sample fl ow rate for LC/MS interfaces. ESI = electrospray interface; APCI = atmospheric pressure chemical ionization. Adapted from Gallagher, et al [3]
Improved In-Peak Concentration for Narrow Bore Columns
But it gets better still. Think about a chromatographic peak. It has width, which may be stated in terms of volume, and it has height (or area) which can be stated in terms of mass. Thus, we have the two necessary pieces of information to calculate a concentration: Mass/ Volume. This average concentration across the peak is called the “in-peak” concentration. Narrow-bore columns exhibit higher in-peak concentration than standard bore columns when injection volumes are properly scaled down.
How much better?
Equation 2 given below shows the maximum in-peak concentration in the mobile phase at the detector (Cmax) [2].

Cmax is dependent on the absolute amount of sample loaded onto the column (m ) and the column efficiency in number of plates (N) and is inversely proportional to the column dead volume (V0), and the capacity factor (k ). V0 is, of course, related to the column internal diameter. It can be shown that the relative value of Cmax for two different columns which have the same stationary phase (i.e. the same k value), and are operated at the same linear velocity [i.e., the same efficiency (N)], is equal to the ratio of the squares of their internal diameters. (You will recall this is the same relationship for the column flow rates in order to maintain the same mobile phase linear velocity.)
Scaling down from a 4.6-mm to a 2-mm internal diameter column increases the “in-peak” concentration at the detector by about fivefold. The increase for a 1-mm column is about 20-fold!
A simple change of column diameter and a little knowledge of how to properly scale down your method can yield remarkable improvements in your ESI LC/MS methods’ limits of detection.
References
[1] Ikonomou, MG; Blades, AT; Kebarle, P “Electrospray-Ion Spray: “A Comparison of Mechanisms and Performance” Anal. Chem. 1991, 63, 1989–1998.
[2] Abian, J, Oosterkamp, AJ, Gelpí, E Comparison of Conventional, Narrow-Bore, and Capillary Liquid Chromatography/Mass Spectrometry for Electrospray Ionization Mass Spectrometry: Practical Considerations, J. Mass Spectrom. 34, 244-254, (1999)
[3] Gallagher, RT; Balogh, MP; Davey, P; Jackson, MR; Sinclair, I; Southern, LJ “Combined Electrospray Ionization—Atmospheric Pressure Chemical Ionization Source for Use in High-Throughput LC-MS Applications” Anal. Chem. 2003, 75, 973–977.
This article is produced in collaboration with Fred Klink. Fred spent seventeen years in the analytical instrument business, and has been teaching highly regarded courses in mass spectrometry, solid-phase extraction, and protein analysis since 1996. Fred's specialty is HPLC and SPE technologies and the application of mass spectrometry to protein characterization. Fred is the author of several journal articles and two book chapters: one on LC/MS for the Encyclopedia of Analytical Chemistry (Wiley, 2010) and another on chromatography systems in Cunico, Gooding, And Wehr, Basic HPLC and CE of Biomolecules (BBL, 1998). Fred is also a principal contributor to the monthly column MS Solutions with Separation Science. He is a member of the American Chemical Society and American Society for Mass Spectrometry.
