In this issue of HPLC Solutions we’ll look at the first two methods, and then consider the third in #126. For additional references, you might want to look at #122 for the determination of noise and #124 for calculation of the signal-to-noise ratio (S/N).
The International Committee on Harmonization (ICH) sets standards for validation of HPLC methods in their Q2(R1) document (1). These are, for the most part, adopted directly by the United States Pharmacopoeia (USP), European Pharmacopoeia (EP), and other pharmacopoeial organizations. In sections 6 and 7 of Q2(R1), three different methods are listed to determine method limits. By method limits, we mean the limit of detection (LOD, also called detection limit, DL) and the limit of quantitation (or quantification, LOQ; also called lower limit of quantification, LLOQ or quantitation limit, QL). When we talk about LOD, we generally mean something like, “I’m sure there is a peak there for my compound, but I cannot tell you how much is there.” For the LOQ, we might say, “I’m sure there is a peak there for my compound, and I can tell you how much is there with this much certainty.”
The methods listed in Q2(R1) are determination:
- based on visual evaluation
- based on signal-to-noise
- based on the standard deviation of the response and the slope
 Figure 1
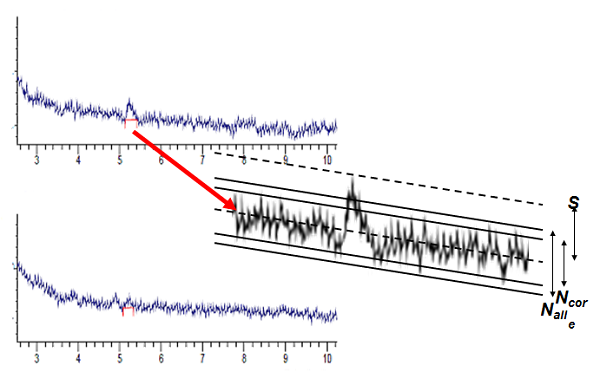
Visual evaluation of the chromatogram to determine the LOD and LOQ is obviously somewhat arbitrary, and therefore subject to operator bias. Consider the two chromatograms of Figure 1. I think that most people would agree that there is a real peak present in the upper one, but might have a difficult time convincing others (or even themselves!) that there is a peak present that can be clearly distinguished from the baseline in the lower chromatogram. Is the upper chromatogram then the LOD? Would you have confidence measuring and reporting the area or height of this peak in a quantitative manner that would allow you to call this the LOQ? You can see the problems involved in visual evaluation. I suggest that this technique be used only to confirm that you made the right decision by a more quantitative approach (one of the second two methods).
Use of the S/N approach to determine LOD and LOQ appears to offer a more quantitative measure than the visual approach, but it is not without its problems. I have expanded the top chromatogram of Figure 1 and marked the signal and both the core (Ncore) and total (Nall) noise (see #122 for definitions). ICH considers the LOD to be S/N of 3:1 or 2:1; for LOQ a value of 10:1 is suggested. Note, however, that the method of calculating S/N is not defined, and the traditional signal-divided-by noise method gives a value that is half of the one used by the USP and EP (see #124).
For the expanded section of Figure 1, I measure (in arbitrary units) S = 87, Ncore = 70, and Nall = 98. This gives S/Ncore = 1.2 and S/Nall = 0.9 by the traditional calculation and for the USP and EP techniques, 2.4 and 1.8, respectively. Three of the four values are below the ICH minimum S/N = 2:1 for the LOD, and none meet the 3:1 option for LOD. Yet many chromatographers would feel comfortable stating that a peak is visually present, so the top chromatogram is at or above the LOD.
I think you can see some of the potential problems associated with using the visual or S/N approaches to determining LOD and LOQ for a method, and as with the visual technique, I recommend that it be used primarily for confirmation of less arbitrary calculations. In #126 we’ll consider the option of determining LOD and LOQ based on statistical performance of the calibration curve.
If you’d like a bit more detail on this instalment of HPLC Solutions , a video clip of this is available at: http://view6.workcast.net/?cpak=5804874214564175&pak=1939778377848693
Note: you will need to register for this HPLC Solutions Learning Portal once, but subsequently will only require your email address for access.
1. International Committee on Harmonization, “Validation of Analytical Procedures: Text and Methodology, Q2(R1), Nov. 2005.
This blog article series is produced in collaboration with John Dolan, best known as one of the world’s foremost HPLC troubleshooting authorities. He is also known for his research with Lloyd Snyder, which resulted in more than 100 technical publications and three books. If you have any questions about this article send them to info@sepscience.com


