In previous instalments of this Back-to-Basics series, we have looked at the retention factor, k, the selectivity, α, and the column plate number, N. Nice as these measurements are, they don’t tell us much about the quality of the separation. For example, you can have k in the ideal 2 < k < 10 region, or α = 1.2, or N = 15,000, but none of these values on their own make the separation any good. As a measure of separation quality, we need to determine the resolution, Rs, which is most commonly calculated as:
Rs = (tR2 – tR1) / ((0.5 * (w1 + w2)) (1)
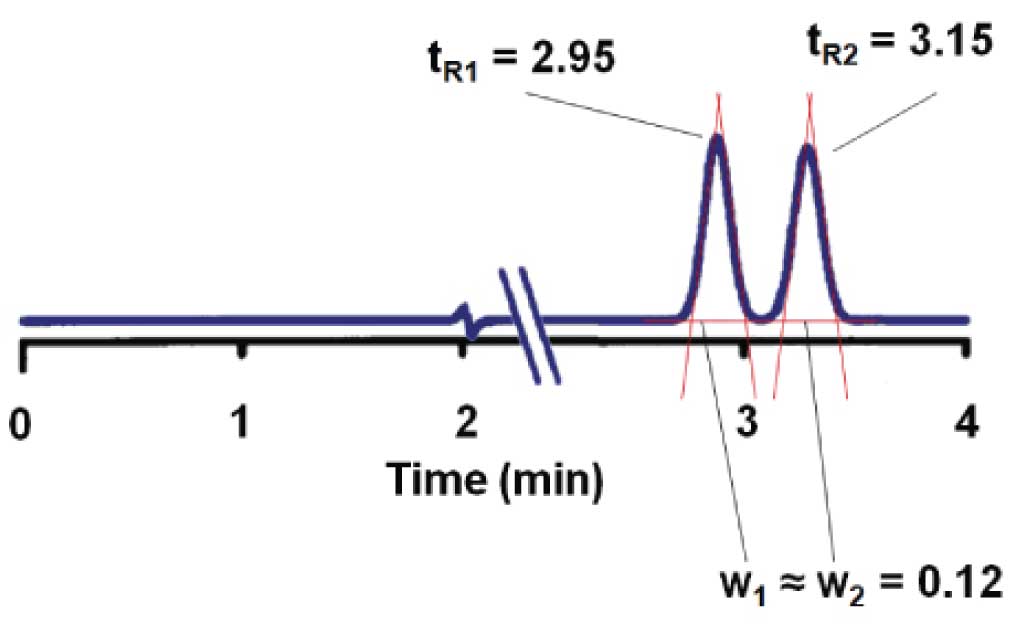
We need to measure the retention times for the two peaks of interest (tR1 and tR2) and the widths of the two peaks at baseline (w1 and w2) between tangents drawn to the sides of the peaks. For the steroid separation of Figure 1, we can calculate
R s = (3.15 – 2.95) / (0.12) = 1.67 ≈ 1.7
If the peaks are perfectly symmetric, which is unlikely, the valley between the peaks should just touch the baseline when Rs = 1.5. So with well-shaped peaks, as in Figure 1, Rs = 1.7 looks pretty good, with a little baseline between the peaks. However, nearly every peak shows some degree of tailing, so to allow for a small amount of tailing and still retain a bit of flat baseline between the peaks, Rs ≥ 2.0 generally is desired.
 Figure 1
The use of equation 1 is convenient and gives good results, but it is useful only if the peaks are baseline-resolved. Often, however, we are most concerned about the resolution when peaks are marginally separated. This means that the peaks may overlap a bit at the bottom, and measurement of the peak width at baseline is not possible. Just as we saw that it is possible to measure N at half the peak height (#32), we can take the same approach for calculation of resolution:
Rs = (tR2 – tR1) / ((1.7 * 0.5 (w0.5,1 + w0.5,2)) (2)
where w0.5,1 and w0.5,2 are the peak widths measured at half the peak height. Note that the factor of 1.7 is added to the denominator to adjust for the difference in width at the half-height. The half-height technique is the way many data systems measure resolution, because it is simpler to measure than the baseline width.
So what represents a good value of resolution? If the peaks have only minor tailing, a value of Rs = 2.0 should be adequate, but as tailing increases, the resolution requirement increases, as well. Rs ≥ 2.0 may not be possible, and values of Rs ≥ 1.7 are fine in many cases. But don’t put all your trust in a number for resolution – confirm visually that the valley touches the baseline between the two peaks. If Rs < 1.7, or you otherwise see peak overlap, you might want to consider quantifying the peaks by peak height, rather than area. The peak height measurement can tolerate much more peak overlap than area can before errors occur.
This blog article series is produced in collaboration with John Dolan, best known as one of the world’s foremost HPLC troubleshooting authorities. He is also known for his research with Lloyd Snyder, which resulted in more than 100 technical publications and three books. If you have any questions about this article send them to TechTips@sepscience.com
