Continuing our saga of split sample introduction, here we discuss measuring gas flows and liner selection for split injections.
Measuring Gas Flows
Most modern GCs and data systems allow electronic setting of nominal split ratios. For proper documentation and verification of instrument health, it is a good idea to verify actual flow rates. Of the two relating to sample splitting (column and split vent flows), split vent flow rate is the most important to check and record for documentation and troubleshooting purposes. You already get a clear indication if column flow rate is as expected from the retention times of peaks.

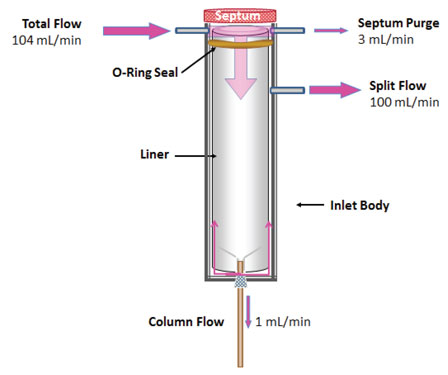
Figure 1: Flow of carrier gas during split injections. Flows shown are typical and correspond in this case to a split ratio of 100:1.
Figure 1 shows the basic design of a split inlet. The flow from a split vent is usually fairly straightforward to measure with your choice of electronic or bubble flow meters. When measuring split vent flows, be sure to turn “Gas Saver” mode (or your instrument’s counterpart) is OFF so that all the flows are in the same state as they would be during sample introduction.
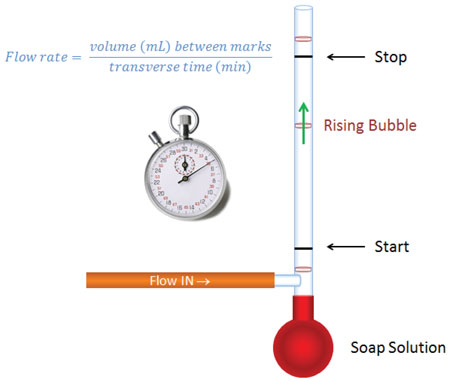
Bubble flow meters are the least expensive tools for measuring flows. As illustrated in Figure 2, they are calibrated pipettes with a rubber bulb acting as a surfactant solution reservoir at the bottom, and a side tube for attaching to the flow source (usually with a rubber tube and appropriate adapter). Surfactant solution (or the foam on its top) is raised to the position of the side arm by squeezing the rubber bulb. As gas flows through the solution, a bubble is picked up and proceeds up the tube. Different sizes of calibrated tube may be necessary to cover the full range of flows one faces in gas chromatography (1 L/min). A timer is used to measure the time it takes for a bubble to pass between start and stop marks for a given volume. It is important to select a meter size that gives you enough time to release the bulb and manage the timer in a repeatable fashion without taking so long that the bubble breaks before it reaches the top mark.
With bubble flow meters, be aware that He and H2 theoretically will diffuse through the bubbles, causing measurements to be lower than actual flow rates. I always put several bubbles in the tube and measure flow rate using the bottom one. I am comfortable in my non-validated assumption that the added segments provide effective isolation from atmosphere and lessen the driving force for equilibration (therefore reducing diffusion through the bubbles) compared to using a single bubble.
There are several styles of electronic flow meters. Some use sensors based on thermal conductivity (called mass flow sensors in this application). They are calibrated (or hopefully they were at some point) for each specific gas. Another style is mechanical and works by measuring the current induced through displacement of a diaphragm (works like an audio speaker in reverse). A third style is an electronic version of a bubble flow meter with sensors that detect the passing of the bubble past start and end zones. Each meter design has its own characteristic “sweat spot” of operation (e.g., the middle 80% of its stated flow range) and its own inherent precision. And just like any measurement tool, it is only as good as its current calibration.

Figure 2: Bubble flow meter. The bottom bulb contains surfactant solution that is squeezed above side arm to form bubbles that rise up a calibrated tube. Different tubes are used for different flow rate ranges such that one has a comfortable amount of time to release the bulb, start and then then stop the timer when a bubble transverses past the start and stop marks. Flow rate = calibrated volume between marks/transit time = mL/min.
Measuring flow rate of the column is sometimes difficult, especially at very slow flow rates. If the column is connected to a tight detector (like an FID) all detector gases can be turned OFF and column flow can be measured using an appropriate adapter from the manufacturer and meter of choice designed for low-flow measurements. If the column is connected to a mass spectrometer, column flow can supposedly be measured at the exhaust port of the rough pump, but in my experience, the measurements always come out low (due probably to many leaks and losses along the way). Certainly, capillary outlet flow rate can be calculated for capillary columns IF you know the exact column dimensions (i.d. & length), temperature, inlet and outlet pressures … most GC and/or data systems provide this calculation. But in most cases, GC users only know “nominal” column dimensions, so the stated flow rates are just estimates. If you have a measureable unretained peak, you could check to see how far off the nominal calculations are and/or you could follow a process to determine the actual dimensions (thereby “calibrating” column dimensions) which would in turn provide a more accurate estimation of actual column flow rate.
Liner Choice
I have several tenets relating to liners for hot split injection. These are subject to change, but I have reached these through years of dealing with inlet development and performance issues.
- Use a liner with large enough volume to contain sample vapors (prevent flashback and losses out the septum purge).
- Use a liner with a taper at the bottom to minimize sample contact with the base plate and to reduce discrimination against high boilers.
- Use glass wool at the top of the liner into which the syringe needle penetrates during injection.
- Select a liner with an effective and stable deactivation. Unfortunately, it is difficult to find meaningful and relevant indertness data from liner manufacturers.
- Be sure the liner outside diameter (o.d.) is not so tight in the inlet that split flow is restricted. Liners for splitless injections should be tight; liners for split injections should be loose.
- Do not cram the liner to the bottom of the inlet such that it presses against the baseplate unless it has an integrated bump at the bottom. Flat liners pressed against baseplates can cause some backpressure at higher split flows. The bump keeps the liner approximately 1 mm off the base plate. If the liner has no bump, then it is a good idea to raise it up 1 mm after pushing it down to the bottom.
With all that being said one must add/modify/qualify for specific split applications.
- The liner volume must not be so large that initial peak widths are broad (important for small-bore columns).
- Solute decomposition problems trump any benefits one might otherwise get from the use of glass wool. If important peaks are lost due to glass wool activity issues, take out the wool. I have found no reasonable substitute (although Teflon wool might be worth a shot for applications with inlet temperatures below 250 oC, although I would not have the needle penetrate it).
For fast chromatography with small bore columns (e.g., 100 µm i.d.), one might have to use a narrow-bore liner with internal volume of < 200 µL. 100 µm columns push the need for split injections to extreme: they operate at low flow rates (e.g., 0.5 mL/min), have very low solute capacity (see Table 1) and require very sharp initial band widths. It is not uncommon for split ratios of > 1000:1 to be used, even with injection volumes of 0.1 µL.
This blog article series is produced in collaboration with Dr Matthew S. Klee, internationally recognized for contributions to the theory and practice of gas chromatography. His experience in chemical, pharmaceutical and instrument companies spans over 30 years. During this time, Dr Klee’s work has focused on elucidation and practical demonstration of the many processes involved with GC analysis, with the ultimate goal of improving the ease of use of GC systems, ruggedness of methods and overall quality of results. If you have any questions about this article send them to techtips@sepscience.com
