An illustrative example of the use of isotope peak ratios to determine an elemental composition.
Taken with permission from Chapter 5 of 'Introduction to Mass Spectrometry: Instrumentation, Applications and Strategies for Data Interpretation', 4th Ed., Wiley: Chichester, UK, 2007 by J. Throck Watson and O. David Sparkman.
Consider Figure 1, which presents an abbreviated portion of a mass spectrum consisting of a group of peaks. Although it is stated that the data are obtained by EI, it is important to realize that because this is not a complete mass spectrum, it cannot be known whether the nominal m/z peak represents a molecular ion or a fragment ion produced by either the loss of a molecule or a radical from a molecular ion. Therefore, the potential answer should not be prejudiced by premature application of the Nitrogen Rule . The data will reveal some characteristics of the ion even though the Nitrogen Rule cannot be applied.
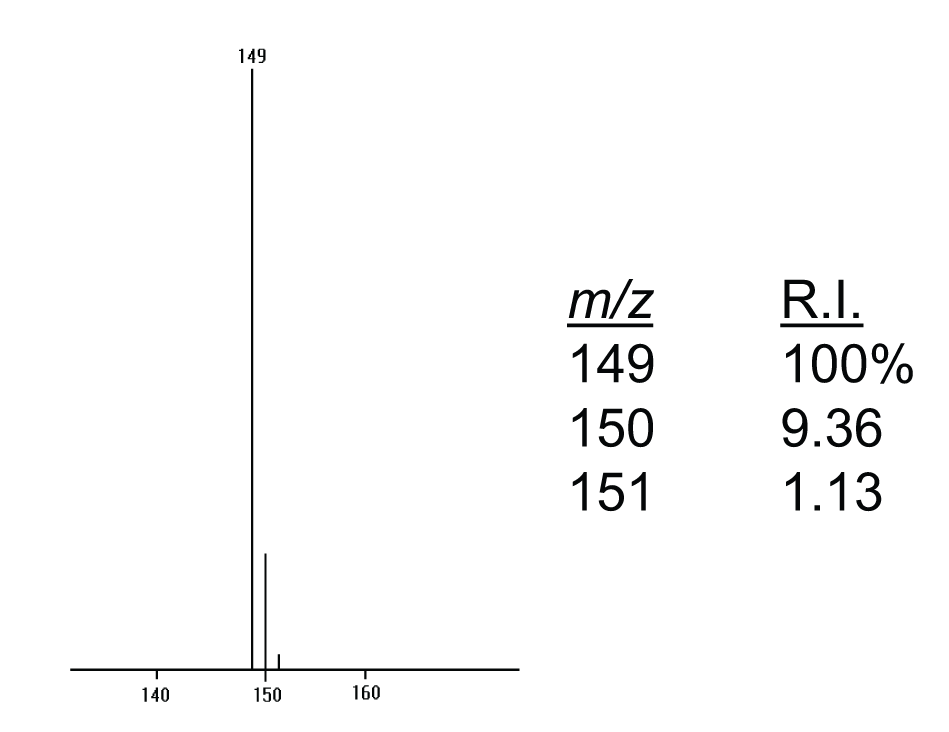
 Figure 1: A portion of an electron ionization (EI) mass spectrum.
The data in Figure 1 are presented in graphical form as a cluster of peaks together with a numerical or a tabular listing of the peak intensities normalized to the most intense peak. The cluster of peaks starts at m/z 149, with isotope peaks at m/z 150 and 151.

In the process of accounting for isotope peak intensity contributions from various elements, it is helpful to prepare a worksheet similar to that illustrated in Table 1. The worksheet for this example should contain three columns, “Mass”, “X+1”, and “X+2” for the series of three peaks in this cluster where Mass refers to the nominal m/z value peak at 149; X+1 refers to the measured relative intensity of the X+1 peak (m/z 150 with a relative intensity of 9.36%); and, X+2 refers to the measured relative intensity of the X+2 peak (m/z 151 with a relative intensity of 1.13%). The first step in the process described earlier (Step 1: Assign the nominal m/z value peak .) has already been done in the process of generating the tabular form of the data. In this case, the nominal m/z value is assumed to be 149.
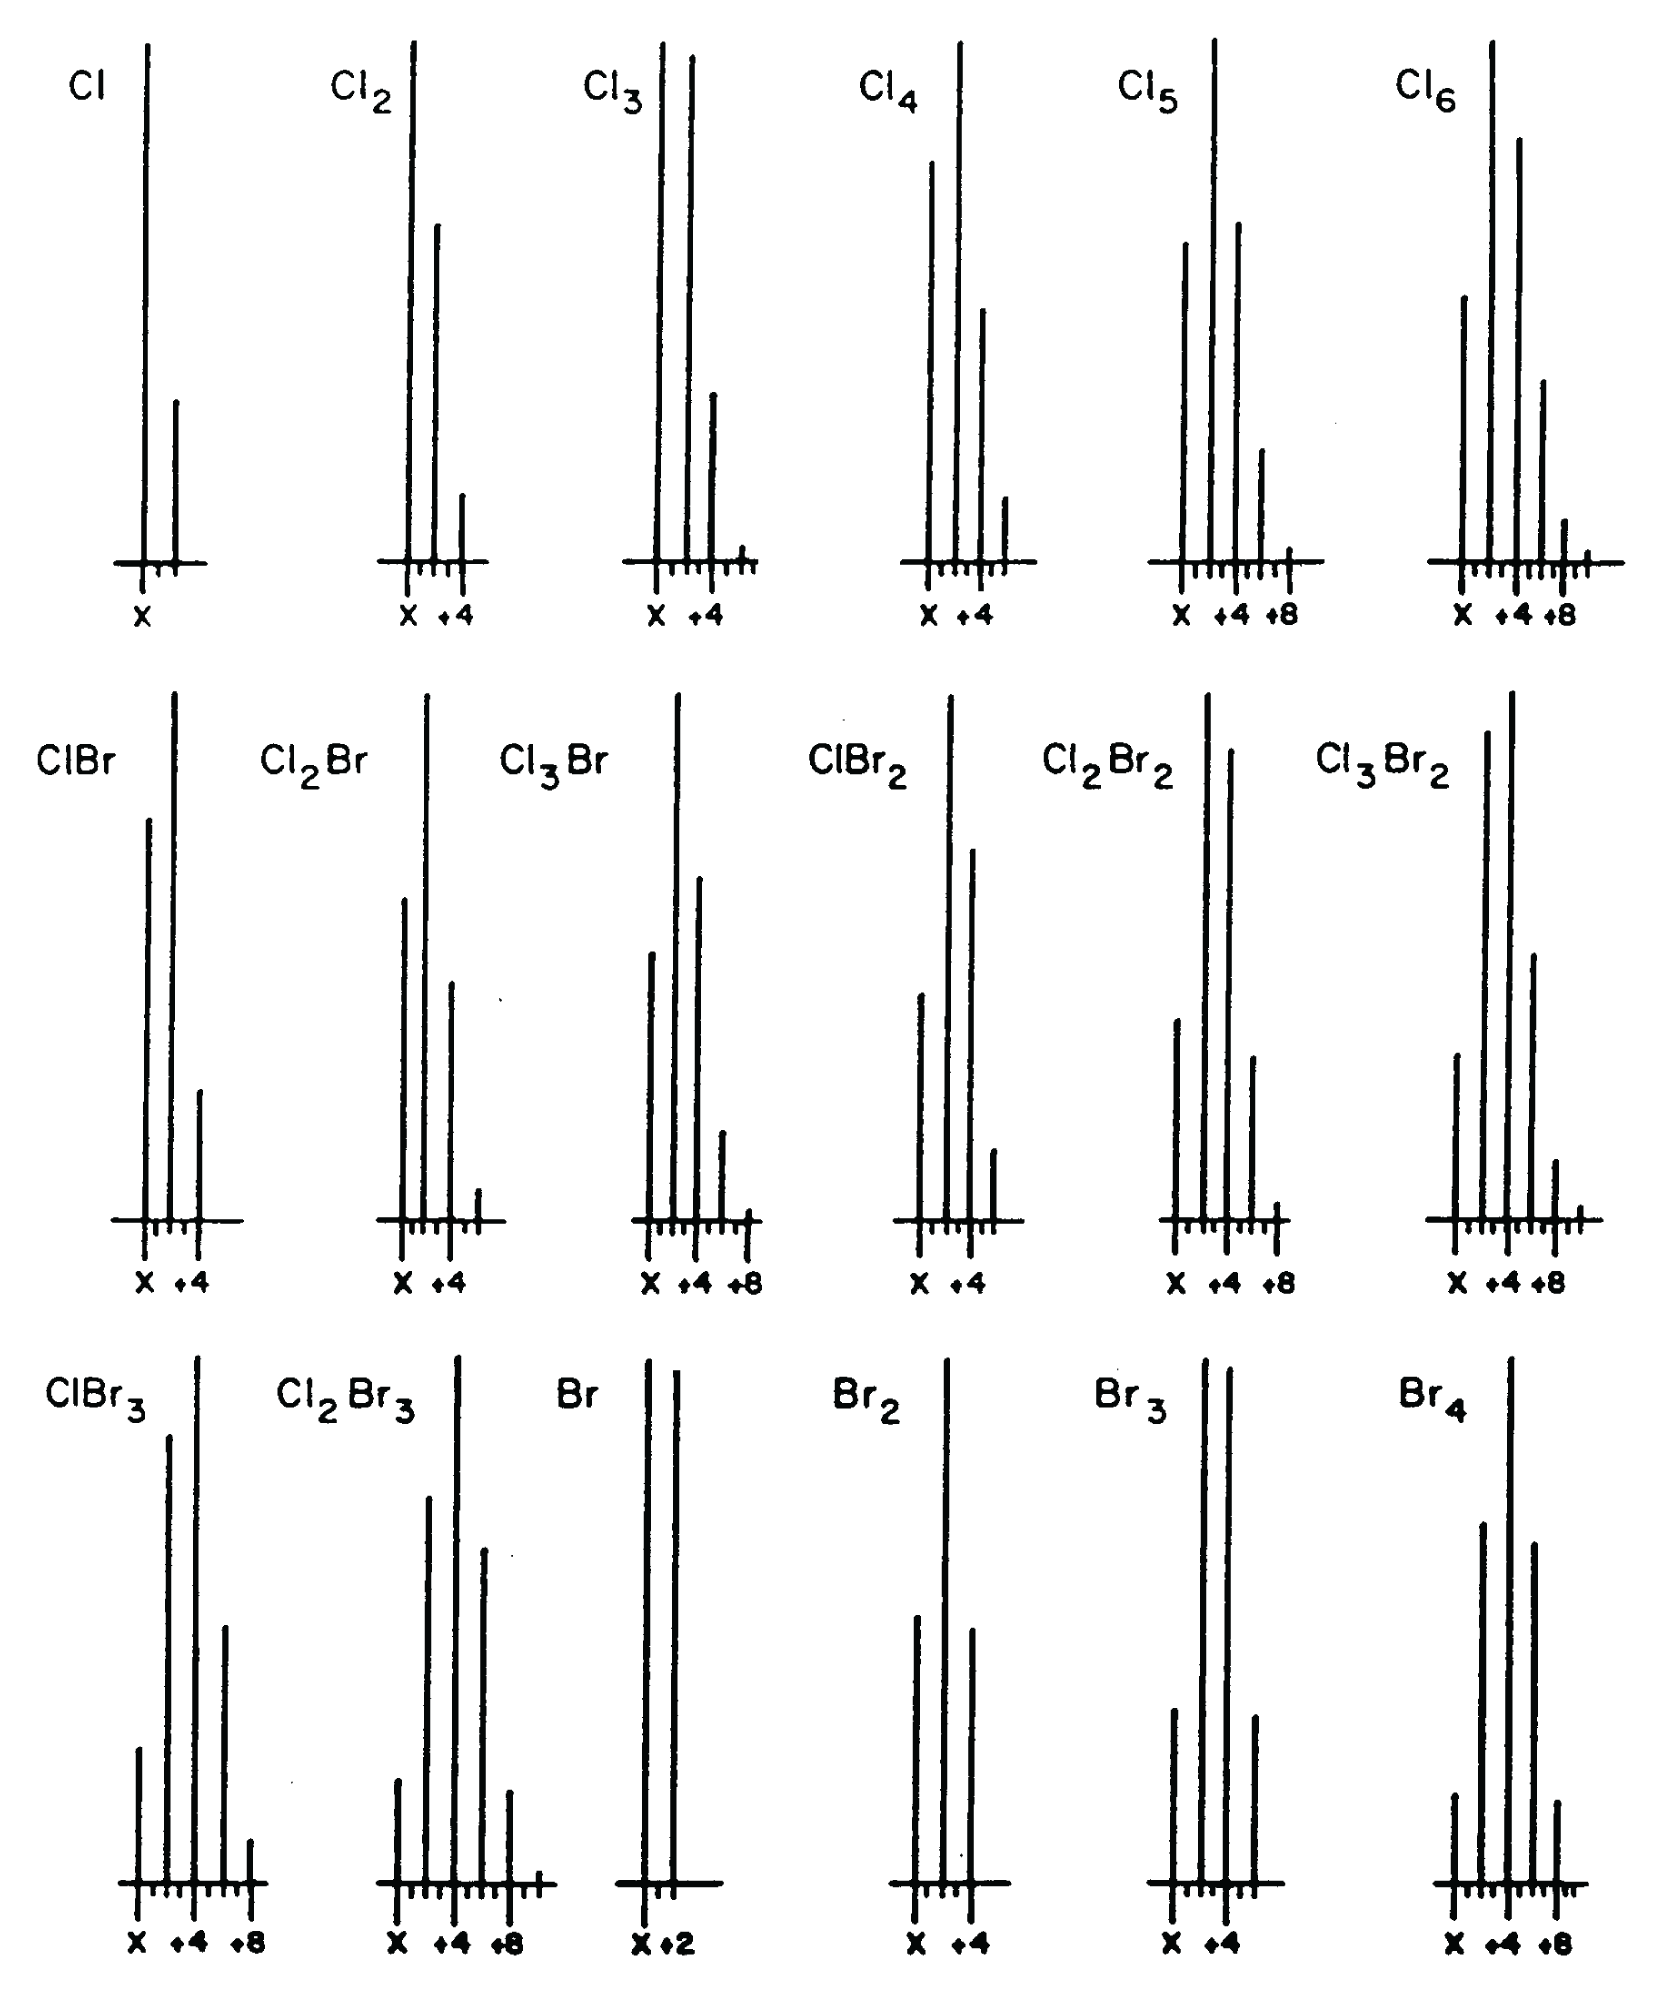
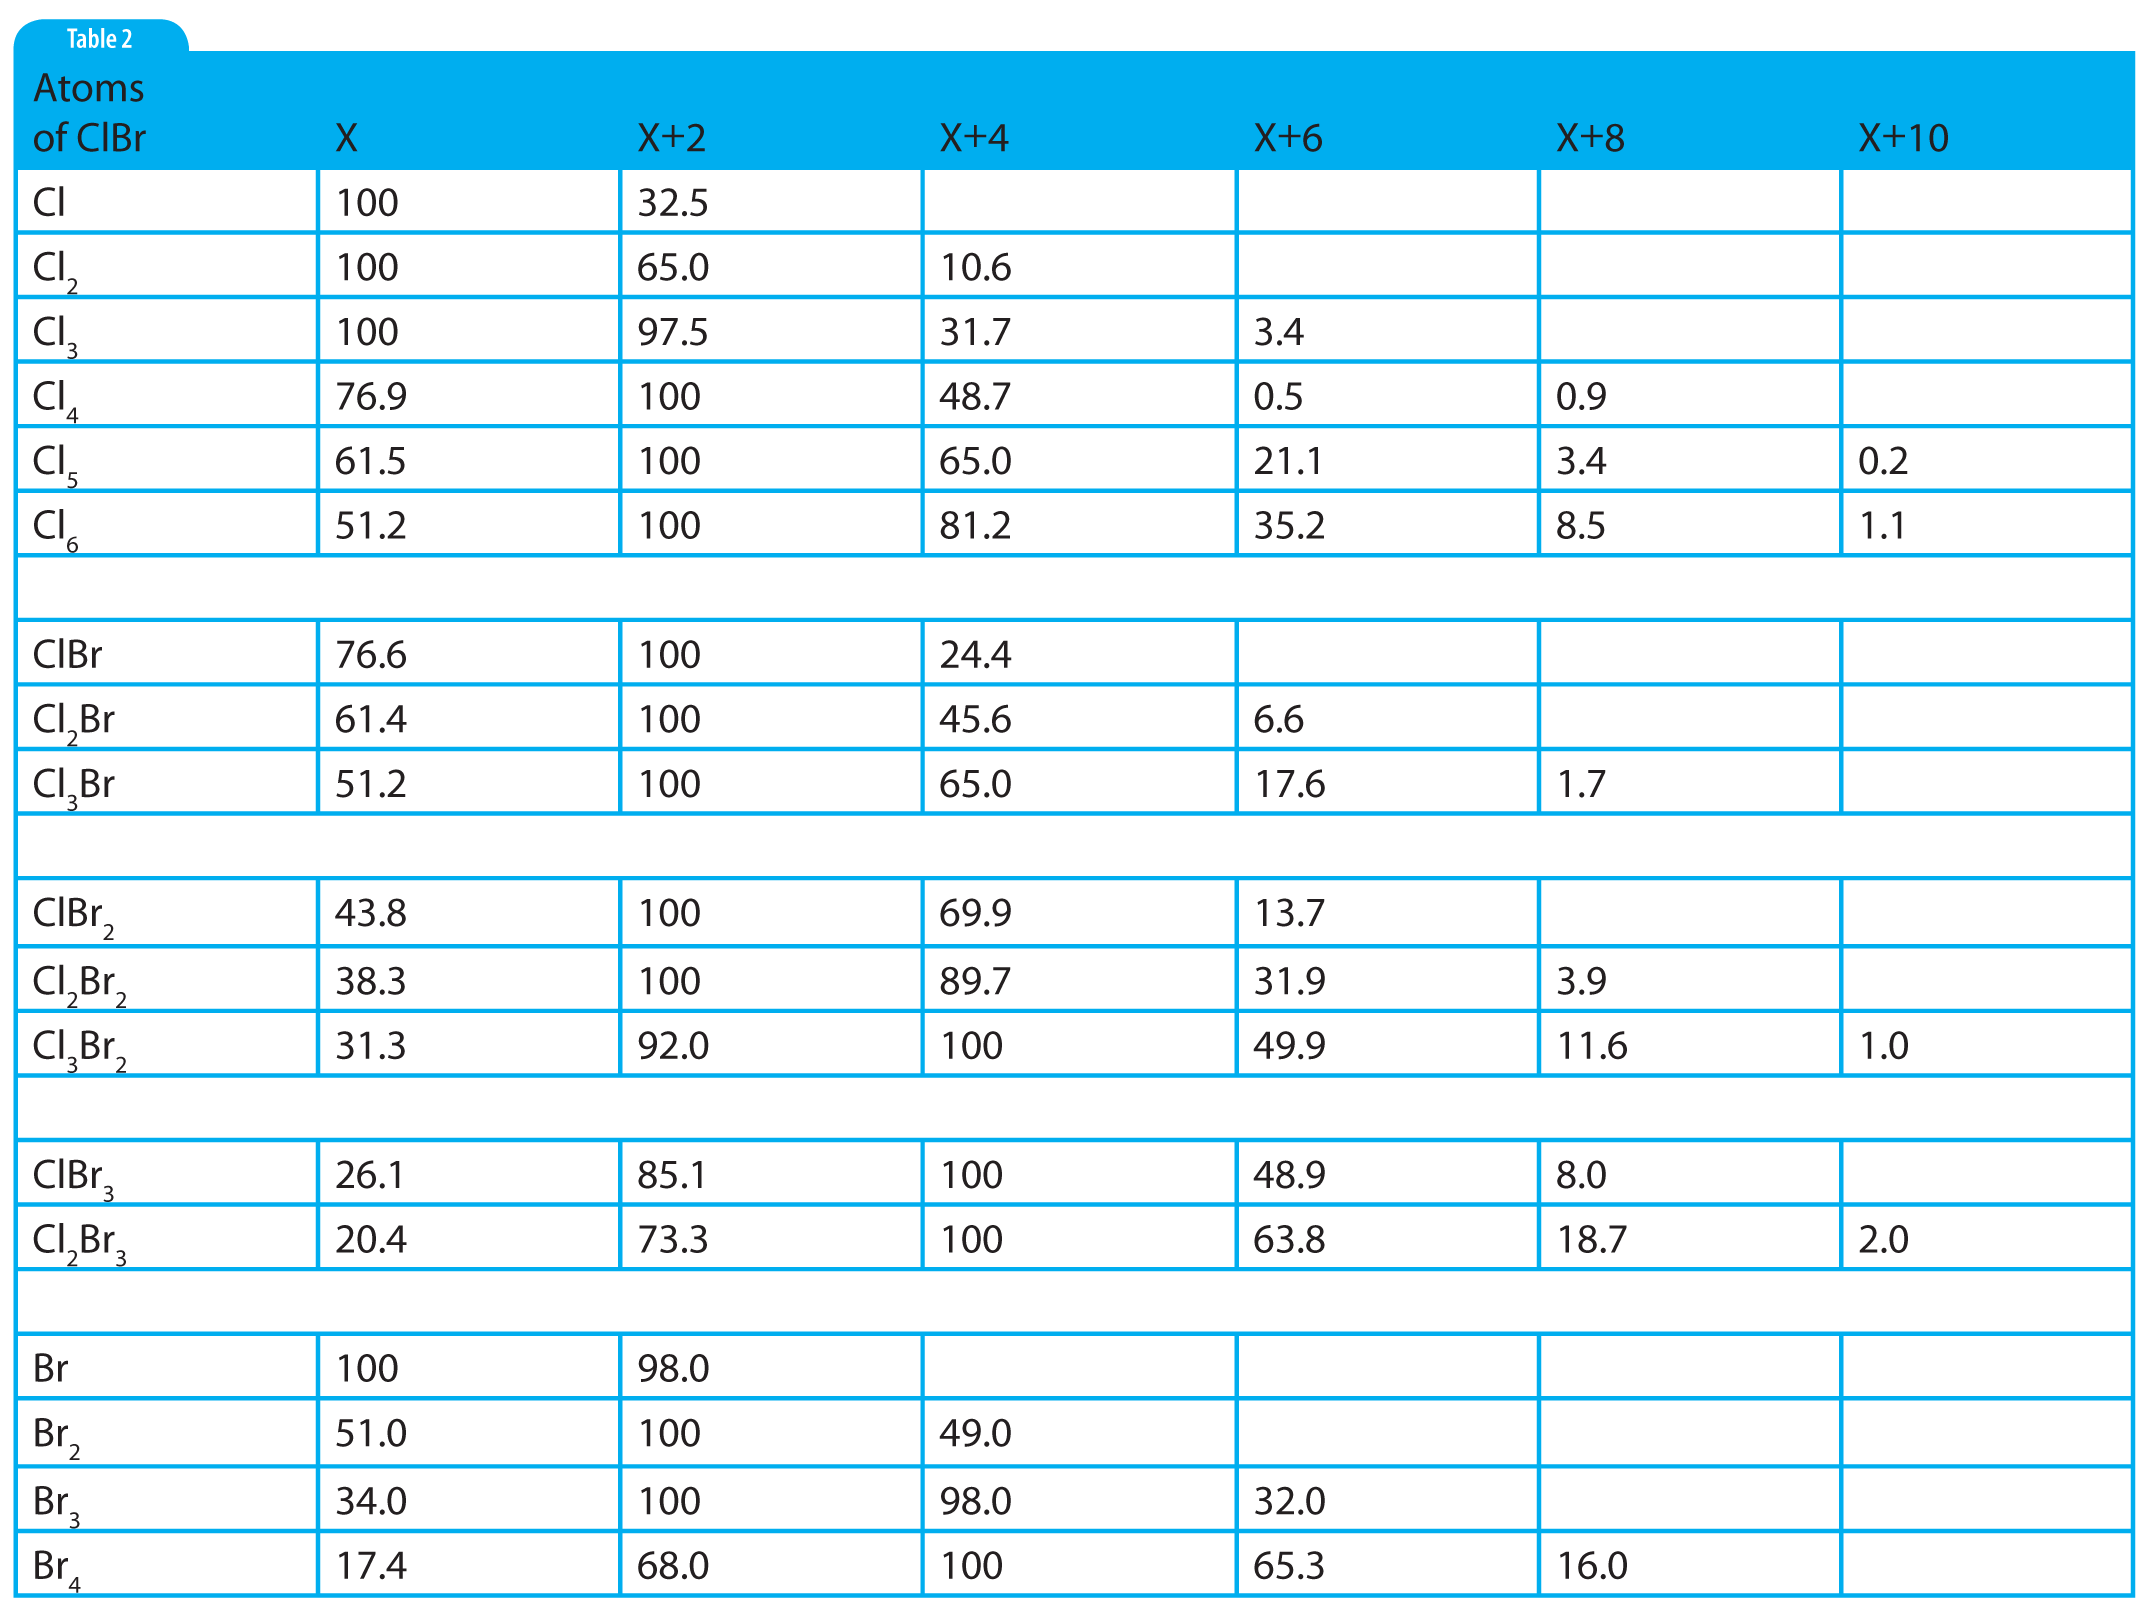
The second step is: Step 2: Assign the number of atoms of X+2 elements with the exception of oxygen (Br, Cl, Si, and S )1. There are no atoms of Br present. If only a single atom of Br were present, the X+2 peak would have a relative intensity almost as great as that of the X peak. If more than one atom of Br were present, the X+2 intensity would be greater than that of the X peak (see reference patterns in Figure 2). There are no atoms of Cl present. If one atom of Cl were present, the X+2 peak relative intensity would be 1/3 the intensity of the X peak and, as with the case for Br, it can be observed from the graphical presentation that neither is indicated. There are no atoms of S or Si indicated. Although not easily determined from the graphical representation of the mass spectrum, examination of the tabular presentation shows that the X+2 peak has a relative intensity of 1.13%. On examination of the X+2 factors for S and Si in Table 1 (Part 1), it is seen that if a single atom of Si were present, X+2 would have a minimum relative intensity of 3.4%; if a single atom of S were present, the minimum X+2 relative intensity would be 4.4%.
 Figure 2: Peak patterns representing ions with atoms of Cl/B
There are no atoms of Br, Cl, Si, or S present in the ion represented by the cluster of peaks in Figure 1. It is as important to know which elements are not present as it is to know which are present in the ion.
The third step in determining the elemental composition from the isotope peak intensity data is: Step 3: Determine the number of atoms of X+1 elements present (C and N) . There are a few important points to remember before assigning the number of atoms of C and/or N: (1) if the peak intensity at X+1 is NOT reported relative to that of X, it will be necessary to normalize the intensity of X+1 to that of X; (2) once the relative intensity at X+1 has been accounted for within the about ±10% of the observed value, STOP! To continue to rationalize the X+1 intensity could lead to over-interpretation. It is always possible to return for further explanation of the intensity at X+1, if necessary; (3) unless the Nitrogen Rule can be applied and shows that there is an odd number of nitrogen atoms present, it is best to start with the assignment of the number of carbon atoms and then assign the number of nitrogen atoms.
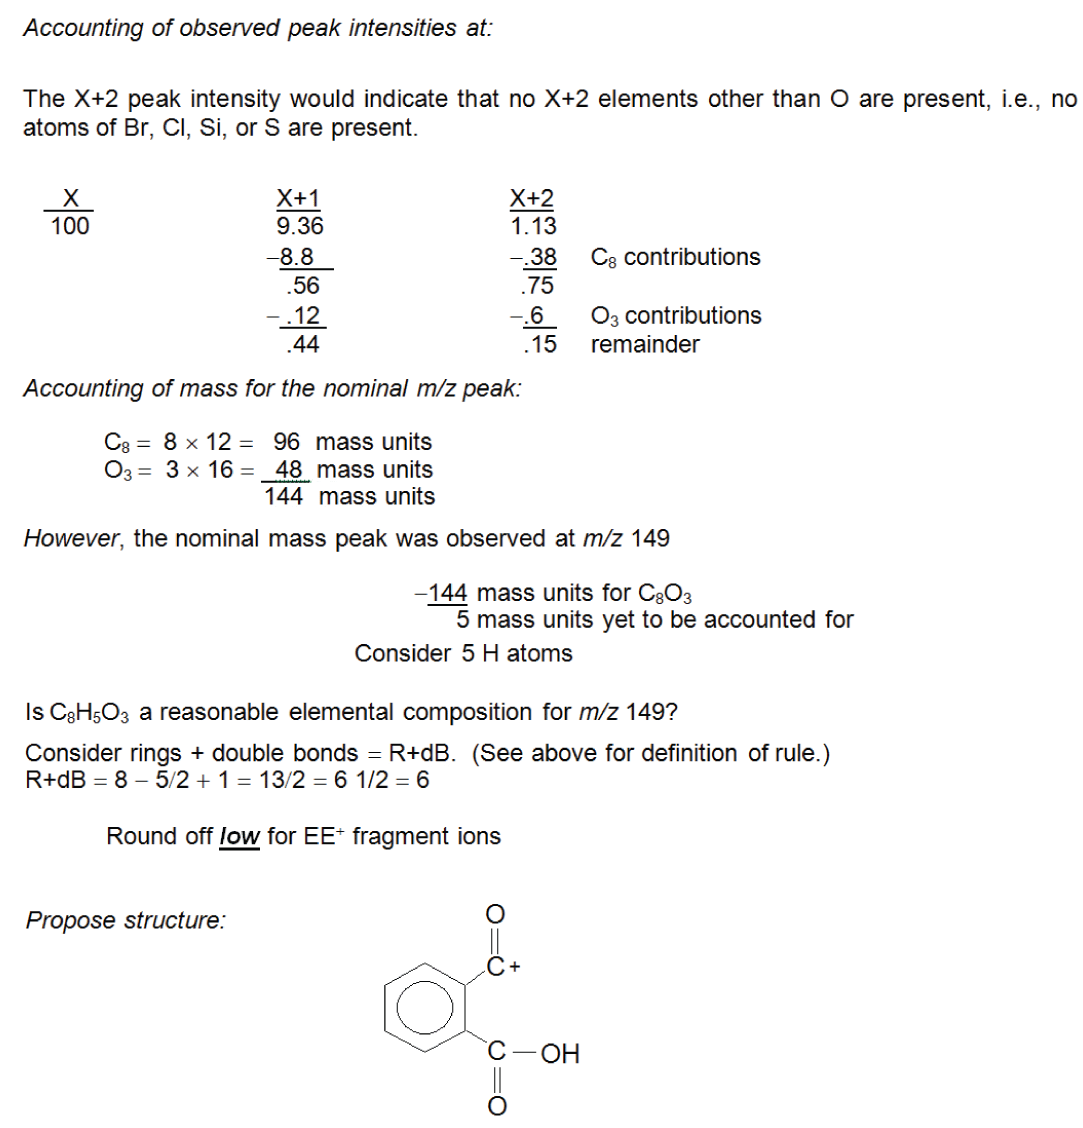
The intensity at X+1 reported in the tabular data is 9.36% in Figure 1. Unfortunately, this experimental value falls between the theoretical values for 8 and 9 atoms of carbon as calculated using the carbon X+1 factors in Table 1, or observed on the X+1 and X+2 relative peak intensities for increasing nos. of C and H atoms (Table 2, part 2). The X+1 value for 8 C atoms is 8.8; and for 9 C atoms, it is 9.9. In the case of 9 C atoms, the theoretical and observed values differ by ±0.54 percentage points. In the case of 8 C atoms, the difference is 0.52 percentage points. Both values are well within the about ±10% limit. Which one should be chosen? There is a rational reason to choose 8 C atoms over 9 C atoms. Look at the observed value for X+2 in the experimental data. Examination of the X+2 column for 8 and 9 C atoms in Table 2 shows that the X+2 values for 8 and 9 C atoms are 0.38 and 0.49, respectively. In the case of 8 C atoms, the X+2 remainder is 0.75; and for the case of 9 C atoms, the remainder is 0.64. Both of these remainders are far greater than the about ±10%. Therefore, there must be a contribution from some source other than the possibility of an ion containing two atoms of 13C. The only other possible contributor at X+2 could be oxygen (which was initially omitted from the above-described consideration for X+2). Oxygen also makes a contribution at X+1, which means that the X+1 value is not only going to arise from the 13C isotope but also from the probable presence of an 17O isotope.

Table 2: Numeric values for ions containing atoms of chlorine and/or bromine.
Based on the above rationalization, 8 atoms of C are selected. This results in a Mass remainder of 53 Da, an X+1 relative intensity remainder of 0.56, and an X+2 remainder of 0.75. The Mass column would easily accommodate an atom of nitrogen. The X+1 column would also accommodate a single nitrogen atom. The nominal m/z value is an odd number. There may be great temptation to consider a single atom of nitrogen. This temptation should be rejected. The X+1 value has been reconciled to within the about ±10% limit. It is unknown whether the nominal m/z value peak represents an OE± ion or an EE+ ion. Therefore, it cannot be determined (from the Nitrogen Rule ) whether the ion contains an odd number of N atoms. The next step in this process of establishing an elemental composition based on intensity of an isotope peak is: Step 4: Assign the number of atoms of oxygen present. The remaining intensity at X+2 to be reconciled is 0.75%. This value rounds nicely to 0.8%.
This could account for as many as 4 atoms of O (at 0.2% each); however, 4 × 16 Da = 64 Da, which is greater than the unaccounted mass. The mass must always reconcile to zero. The maximum number of O atoms allowed based on the remaining mass is 3. Reconciling the three columns in Table 1 leaves 5 in the Mass column; 0.44 in the X+1 column; and 0.15 in the X+2 column.
