by Gary Mallard and O. David Sparkman
AMDIS is designed to do analysis for target compounds in a GC/MS data file. To do the analysis you need a completed data file (AMDIS reads most current and many older instrument formats as well as standard formats such as netCDF and mzXML) and a target library. You can put a target library together from standards using AMDIS or by extracting spectra from another library such as NIST11. The download package (see end of article) contains a small library that can be used for the data files in the tutorial with the download package. The details of creating a library of your own will be covered in a later article. The examples used here will come from the tutorial package so that if you choose you may download the entire package and run the data for yourself (see end of article for download address).
AMDIS is launched either from the icon installed by the installation package for from the explorer by double clicking on the program name “AMDIS_32.exe” (or just AMDIS_32 if you do not have the explorer display extensions of known types).
The very first time the program comes up you will be given a dialog box that asks you to specify a default instrument. This can be changed at any time, but at this time you should select the instrument that you normally use. For the tutorial files you would select “Agilent Files”, but whatever you select now can be changed later depending on what kind of data file you need to analyze. Once you have selected an instrument type the program is up and running and you see a blank screen.
Once the program is up and running you will need to specify:
1. The name of the data file
2. The target library name
3. The calibration file (if you are using retention indices) - covered in part 2.
In this article we will specify the command in bold, so to select a data file you would select File/Open (i.e., select File from the top menu bar and then Open from the drop-down menu), and use the file selection box to select the data file that you want to analyze. Note that the program will have remembered the default file type, but the drop-down menu and the bottom of the file selection box will allow you to select a file from a different instrument type. The file open dialog can be navigated to the file that you want to analyze. In this case we will take the tutorial file Card5p.D. (If you have used the default conditions in the AMDIS set-up, the file will be under the subdirectory Tutorial in the AMDIS subdirectory).
The target library must now be selected. Select Analyze/Settings/Libr . The library tab (Libr .) is one of the tabs in the tabbed dialog that comes up when you select Settings . Highlight Target Compound Library and select Select New . In the file selection box that comes up navigate to the Lib subdirectory in the newly installed AMDIS folder and select Pestplus.MSL.
You have now selected the file to be analyzed and the library that you want to use. This is the minimum information required for AMDIS to work. There are, however, many ways to have AMDIS analyze the data file; simply select the Identification (Identif. ) tab to specify how the analysis is to be performed. For this example select Simple in the drop-down menu for Type of Analysis . Finally, type 60 in the box labeled Minimum match factor . These last two parameters should have been present when you installed AMIDS, but if you are coming back to the program they may have changed. Finally, select Save. The program may ask you if you want to rerun the data, if so select ‘yes’, otherwise click the Run button at the top of the window.
The resulting screen will look like Figure 1.
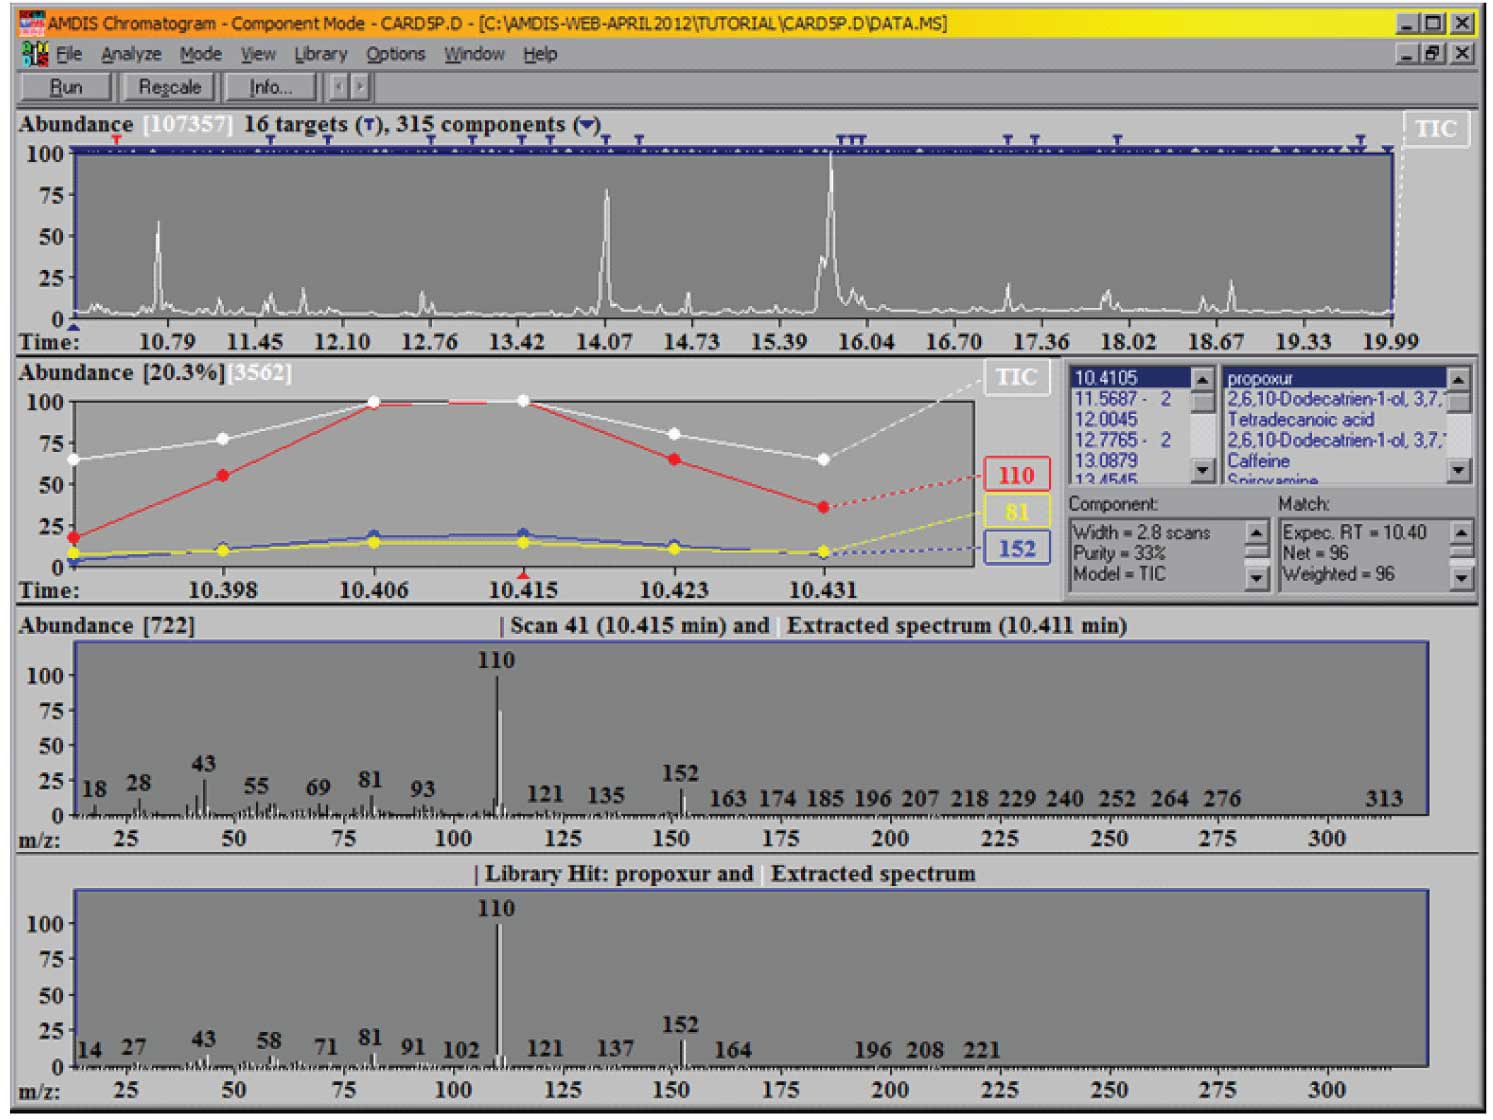
Figure 1: AMDIS after completion of a deconvolution and analysis of a data file.
What you see here on the top panel of the screen is the reconstructed total ion chromatogram (TIC), together with an indication of how many components (black inverted triangle) and how many targets (T) have been found. Note that the targets are derived from your target library; the components are then derived from the data file. Each component is compared against the target library and all that have match factors greater than the one you have specified will be displayed. As the default condition for the match factor is 60 (we did not change from the default when we set up the analysis) the minimum match factor that will be reported is 60 (out of 100).
Note, we have a very large number of components in the mixture and have found 16 targets from the library. You can examine the identified targets in more detail either by clicking on the T’s above each target or by scrolling through the target list on the right-hand side of the window. Whenever you select a target from the list, you will see that the expanded chromatographic data to the left of the list changes to allow you to see the TIC and the most important ions from the target in greater detail. In addition, the two lower windows change to show you the relevant information for the scan, the extracted spectrum and the library spectrum. The upper of these two windows shows the extracted (or deconvoluted) spectrum (in white) and the raw spectrum (in black) at the center of the component. Scroll down the list of targets until you see ‘Mepanipyrim’ and select it. The two windows are shown in Figure 2.
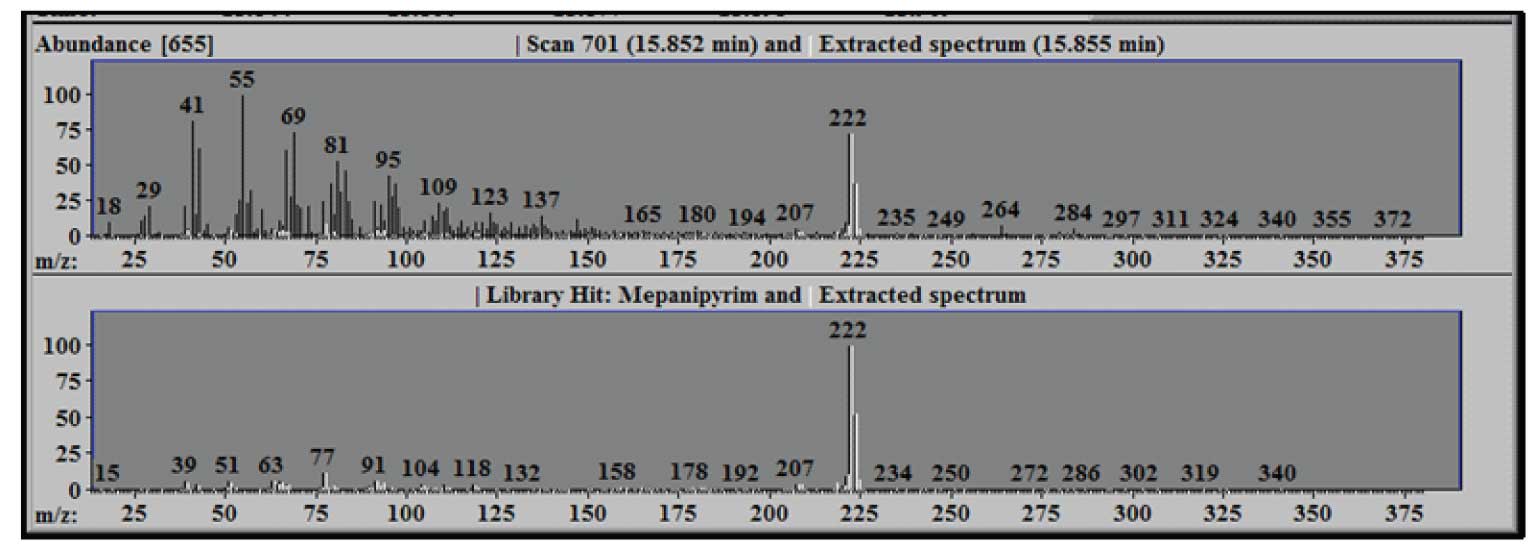
Figure 2: Extracted Spectrum-White compared to Raw Scan-Black (upper) and Library Spectrum-Black (lower).
Note the large number of ions that are present in scan 701 (shown in black) and the relatively low number of ions that are a part of the extracted spectrum (shown in white) – in this case only about 9% of the total ion current is a part of the extracted target spectrum. The lower panel compares the library spectrum of Mepanipyrim (in black) to the extracted spectrum (again in white). Using the mouse it is possible to zoom (hold down the left mouse button at one corner of the region to be zoomed and drag the mouse to the opposite corner) for any of the graphic windows in AMIDS. Doing so in either of the lower windows will make the other window conform to the same dimensions.
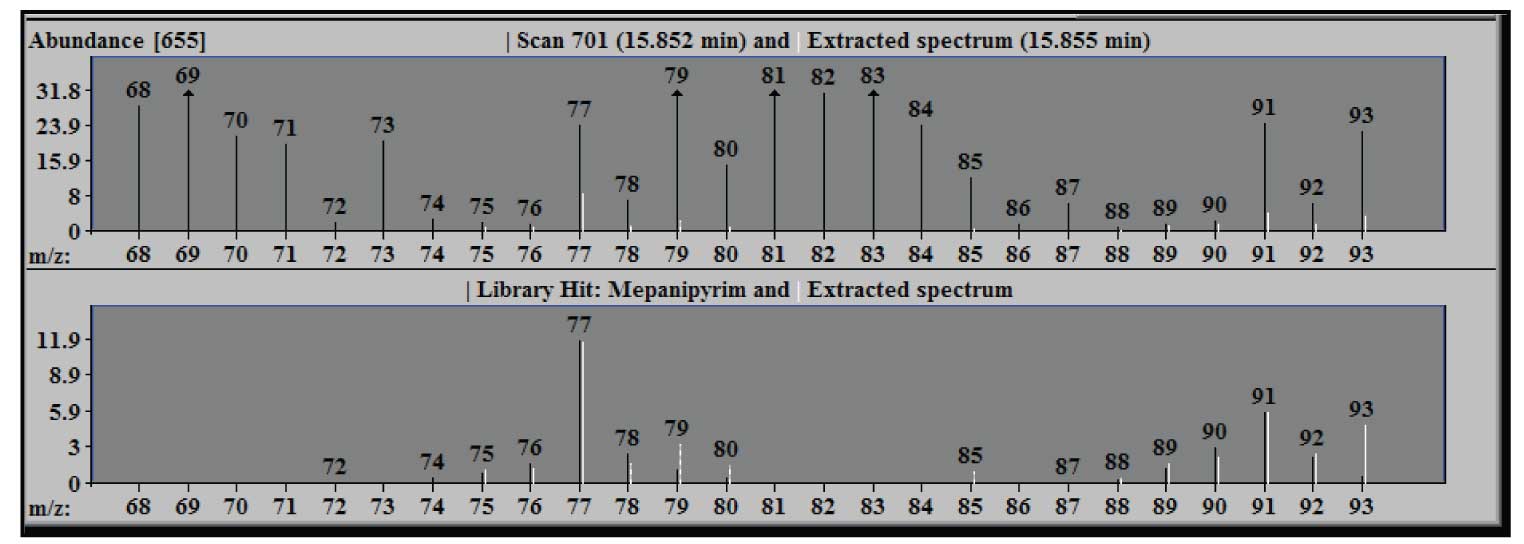
Figure 3: Blow up of figure 2 from m/z 68 to 93 - note only part of m/z 77 extracted.
Figure 3 shows an expansion of the window in Figure 2 to illustrate the results of the deconvolution of the m/z 77 peak of the component. The extracted spectrum in the upper window, when zoomed, shows that only about a third of the experimental intensity (black line) for this ion is extracted –the white line (extracted) at m/z 77. In the lower panel the extracted m/z 77 (white) has a relative intensity that is essentially the same as the library value (black). Note that the intensity in the upper pane is expressed in absolute units (the scale factor on the axis is multiplied by the abundance multiplier at the top), but the units in the library window are relative to the base peak of 100. The arrows at the tops of some peaks indicate that the actual intensity value is off scale in the zoomed spectrum.
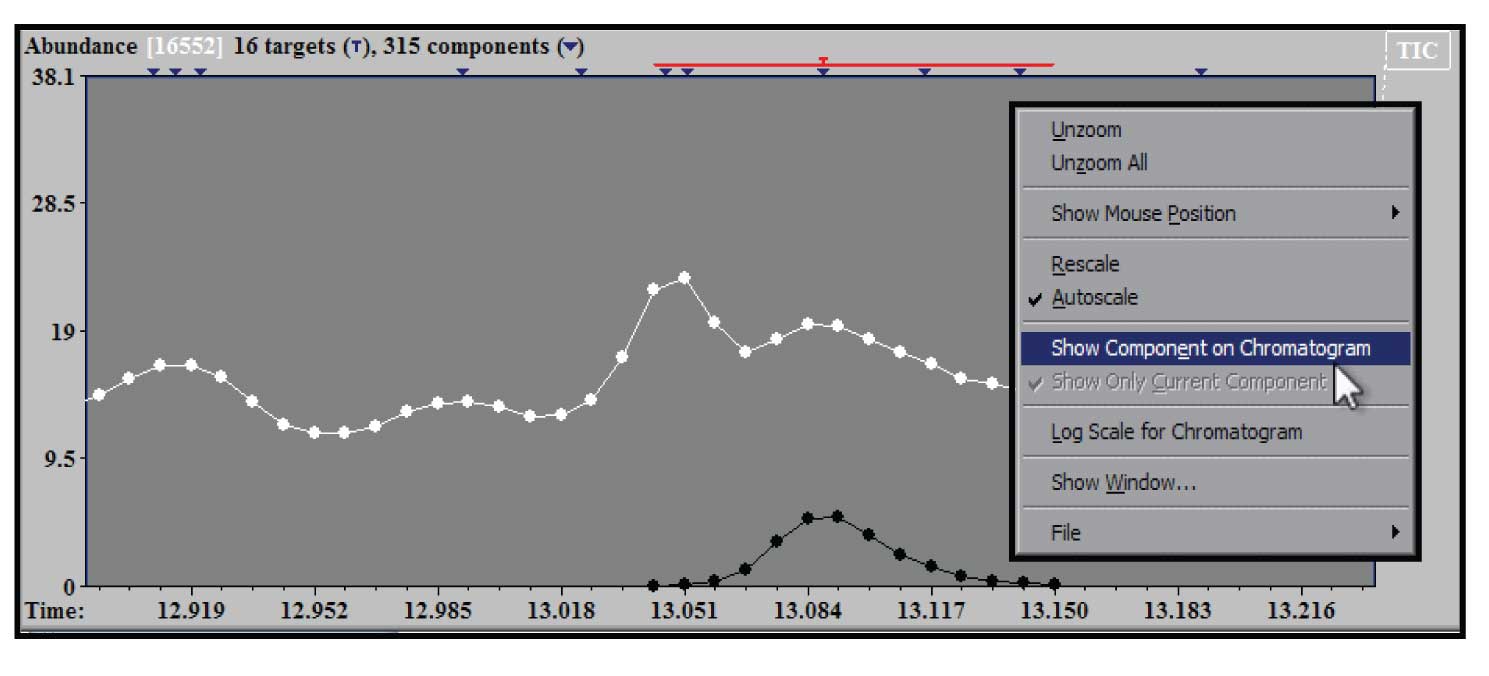
Figure 4: Zoom of TIC showing deconvoluted component and right mouse click window.
To examine a section of chromatogram more closely the same drag and zoom with the left mouse button in the upper (TIC) window will provide an expanded view. In addition the window can be zoomed multiple times. The example in Figure 4 shows the effect of two zooms on the original TIC in the region of the chromatogram near the component identified as caffeine. In addition, Figure 4 shows the window that appears when you click on the right mouse button when the cursor is in the TIC window. There are several choices in this window – the one highlighted is the “Show Component on Chromatogram”. When this is selected (it will show up checked in the box) the extracted TIC will be shown in black compared with white for the experimental TIC. This allows us to see exactly what the shape of the purified component that AMDIS deconvoluted has extracted from the original TIC with a zoomed window on it. This figure also illustrates that when the expansion of the chromatogram is at an extreme, the individual time points at which a spectral scan were taken are shown. All of the windows in AMDIS have display controls that are activated by the right mouse button.
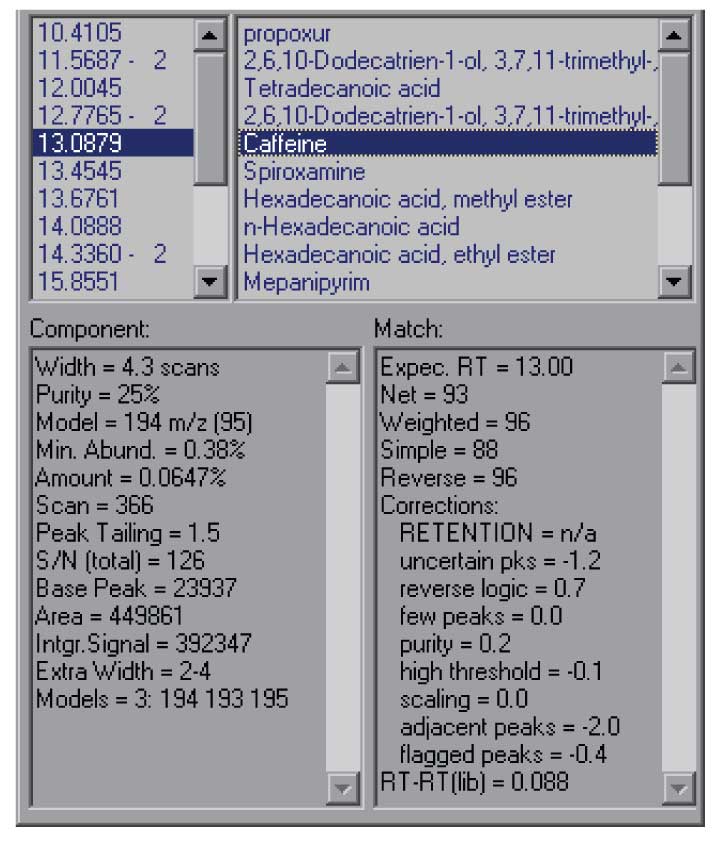
Figure 5: Undocked results window showing more information for each hit.
The Show Window selection that is present in all of the graphic windows will allow you to change the way AMDIS looks, removing windows that are not useful to you or allowing you to make better use of the window size of your computer. In addition, it is possible to undock the results windows from the program so that you can expand them independently of the size of the other window. This option can be reached either from the menu-bar (View/Undock), or by right clicking in the portion of the results window that gives component times. This will allow you to see more of the information about each hit and to see more of the hits in a single window. This is the best way to view the details of the component that AMDIS has extracted from the data file. The results of undocking the results window are shown in Figure 5.
The data shown in the results window are for the identification of caffeine at 13.09 minutes. The data shown include the net match factor (93 in this case), and a number of parameters that help you decide on the overall quality of the result. On the left-hand side of the lower windows is the information from the deconvolution itself. Even if a component is not identified as a target compound this information is present. It can be very valuable in determining how confident you are in the deconvolution.
For example, the Purity data (25%) shows what fraction of the experimental TIC is explained by the extracted component. For very low values, there may be difficulty in extracting a complete spectrum. As you can see in Figure 4, there is substantial background – probably the result of pentadecanoic acid peaking at 13.05 min which has a long tail under these conditions.
The minimum abundance shows the smallest peak (relative to a base peak of 100) than can be extracted – this is a statistical parameter based on the noise and the relative size of the base peak. In the case of the data shown here this means that peaks less than ~0.4% of the base peak are not reliably extracted.
In addition, the number of model peaks that the program used in the algorithm to extract the data is shown. The model peaks are the peaks that show the most characteristic shape for a component. The more model peaks that can be extracted the more confidence that you can have in the resulting data.
These are only a few of the parameters relating to the deconvolution and the match that AMDIS produces. Using these parameters can allow you to judge how much confidence that you can place in the data. For target analysis, that is finding the things that are in your target library. Some of these parameters are in part taken into account in the net match factor, however if you are using AMDIS to find components that are unknown then this information becomes more important.
Finally, the analysis that we have discussed here does not utilize retention information at all. In part 2 of “Setting Up and Running a Deconvolution and Target Analysis”, we will discuss setting up and using the retention information.
A demo version with a limited library of the NIST MS Search Program may be downloaded. Click here>>
AMDIS may also be downloaded by itself. Click here>>
Gary Mallard was at NIST for 31 years and for the last 10 was Group Leader of the Standard Reference Data Group which was responsible for the NIST MS Database and the NIST WebBook. At NIST he was active in both writing the help files and part of the quality control for AMDIS. After leaving NIST he was Head of Laboratory for the Organization for the Prohibition of Chemical Weapons (OPCW) for 3 and a half years. He has developed a number of courses on AMDIS for training at the OPCW and continues to teach new inspectors for the Organization. He has also given AMDIS courses for instrument companies, the FDA, the CDC and at a number of laboratories in Europe, China and the United States. He is currently working on using AMDIS to develop databases of unidentified compounds in common matrices and improvements in the AMDIS software under a contract with NIST.
O. David Sparkman is currently an Adjunct Professor of Chemistry at the University of the Pacific in Stockton, California; Contractor to the National Institute of Standards and Technology Mass Spectrometry Data Center; President of ChemUserWorld.com; and a former American Chemical Society Instructor (1978–2006) and American Society for Mass Spectrometry Member-at-large for Education (2004–2006).
At the University of the Pacific, Prof. Sparkman teaches courses in mass spectrometry and analytical chemistry and manages the mass spectrometry facility. Over the past 28 years, he has developed and taught five different ACS courses in mass spectrometry; he holds positions on the Editorial Advisory Boards of the European Journal of Mass Spectrometry and the HD Science GC/MS Update – Part B; and is the Book Review Editor for the European Journal of Mass Spectrometry. He is the author of Mass Spectrometry Desk Reference (Global View Publishing: Pittsburgh, PA, 1st ed. 2000; 2nd ed. 2006). Prof. Sparkman is a member of the Editorial Boards of the John Wiley Encyclopedia of Environmental Analysis and Remediation and Encyclopedia of Analytical Chemistry, Editor of and a contributor to the Mass Spectrometry Section of the Encyclopedia of Analytical Chemistry, and a contributor to the Encyclopedia of Environmental Analysis and Remediation. Along with J. Throck Watson, he developed the Mass Spectral Interpretation Quick Reference Guide.
He also provides general consulting service in mass spectrometry for a number of instrument manufacturers, manufacturing companies, and government agencies.
