by Gary Mallard and O. David Sparkman
The identification of components by GC/MS in complex mixtures has essentially two parts – extracting a spectrum that is due to a single component and then identifying the component, usually through a library search of the unknown spectrum. Identification is typically the result of searching large libraries and high-quality search algorithms and has been discussed in a previous series [NIST 11- O. David Sparkman]. Unfortunately, if the spectrum sent to the library search routine is not from a single component or is missing major mass spectral peaks, the answer from the library search has far less confidence. For many applications it is sufficient to simply allow the instrument data system – sometime with operator assistance – to average over a peak and take a nearby region as a background for subtraction. For chromatographically isolated components, this is a reasonable, although laborious approach; however, with complex chromatograms the problem can become impossibly to reasonable effect such manual deconvolutions. The spectrum that is extracted may have mass spectral peaks from adjacent components or the background subtraction may remove or diminish peaks that are a part of the spectrum.
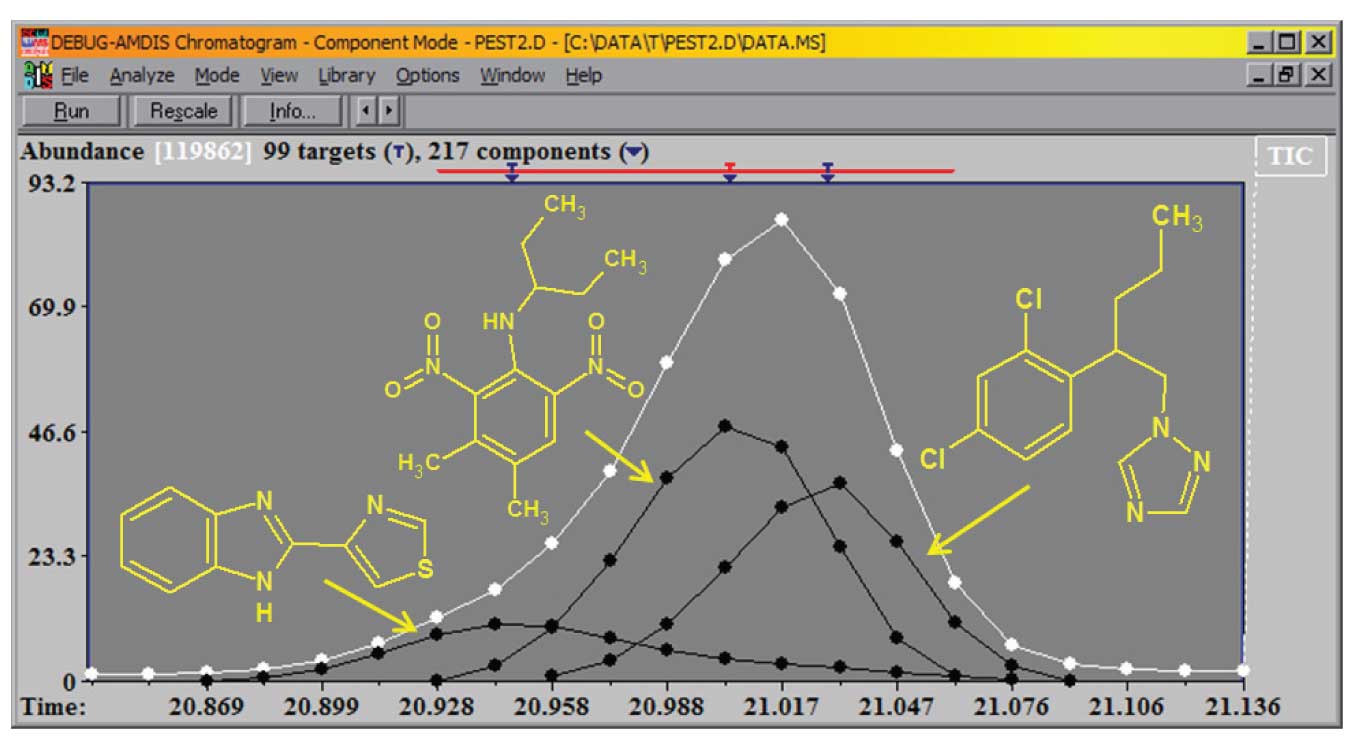
In a case such as the one shown in Figure 1, when three distinct compounds elute within a range of 12 spectra having strong overlap, it is difficult to find a location to take a baseline for background subtraction. Simply going to the region before or after the reconstructed total ion chromatograms (TIC) peak will not produce a clean spectrum. In this case AMDIS easily identified (Match Factor (MF) > 94 for each) and quantitated all three compounds. The black lines are the TIC for each of the three components.
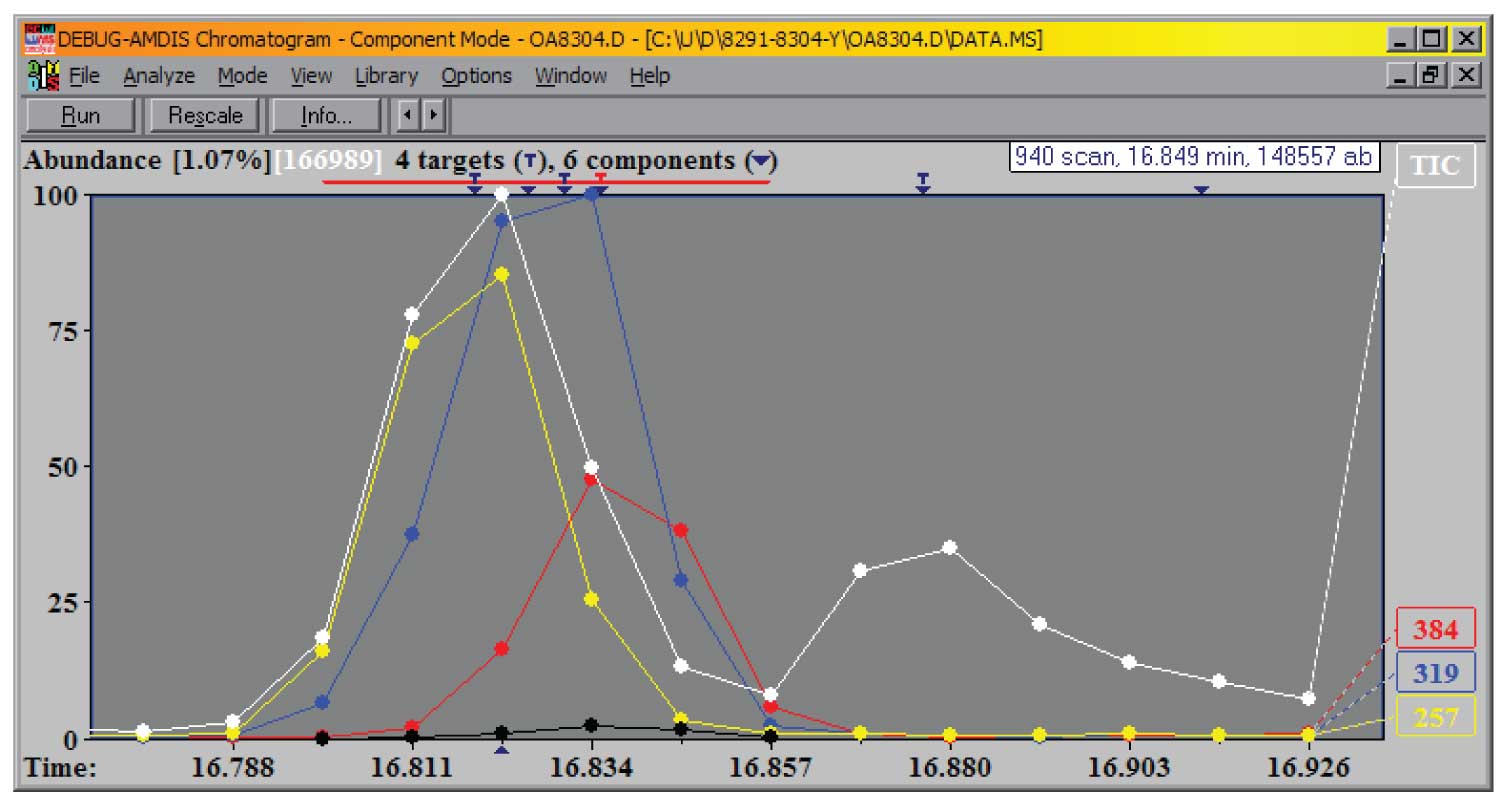
To accomplish this separation of a complex data file into distinct components AMDIS uses the same kind of logic that you would use when looking at the data – it looks not just at the TIC but the extracted ion chromatogram (EIC) for every integer m/z value in the data acquisition range. The EICs that rise, maximize and fall together are assigned to a common component. Because every ion is examined independently, even very small components in large backgrounds can be extracted, providing the minor component has any distinct ions or even if the ions that are common have very different relative intensities. The example in Figure 1 is from a mixture created to test the programs ability to separate components. Often even more difficult tests can be found in practical experiments where there are variable levels of noise in the data. Figure 2 shows EICs of three ions characteristic of each of the three components eluting around 16.81 minutes.

Figure 1: Multiple components extracted from a single TIC peak.
These components are the TMS derivatives of citric acid, isocitric acid and 3,4-dihydroxyphenylacetic acid in a derivatized pediatric urine sample. The major component is the citric acid and an ion with a minor abundance in the citric acid spectrum is shown (m/z = 257), along with more abundant ions for the other two components. The black line is the extracted TIC for the third component.
If you look carefully you can see the three ions peak at very slightly different times (indicated by the T’s on the upper axis), but all three peak within about 1.5 scans (shown as the white dots). Unlike the first example, the relative concentration of the three components is about 50:2:1 from left to right.
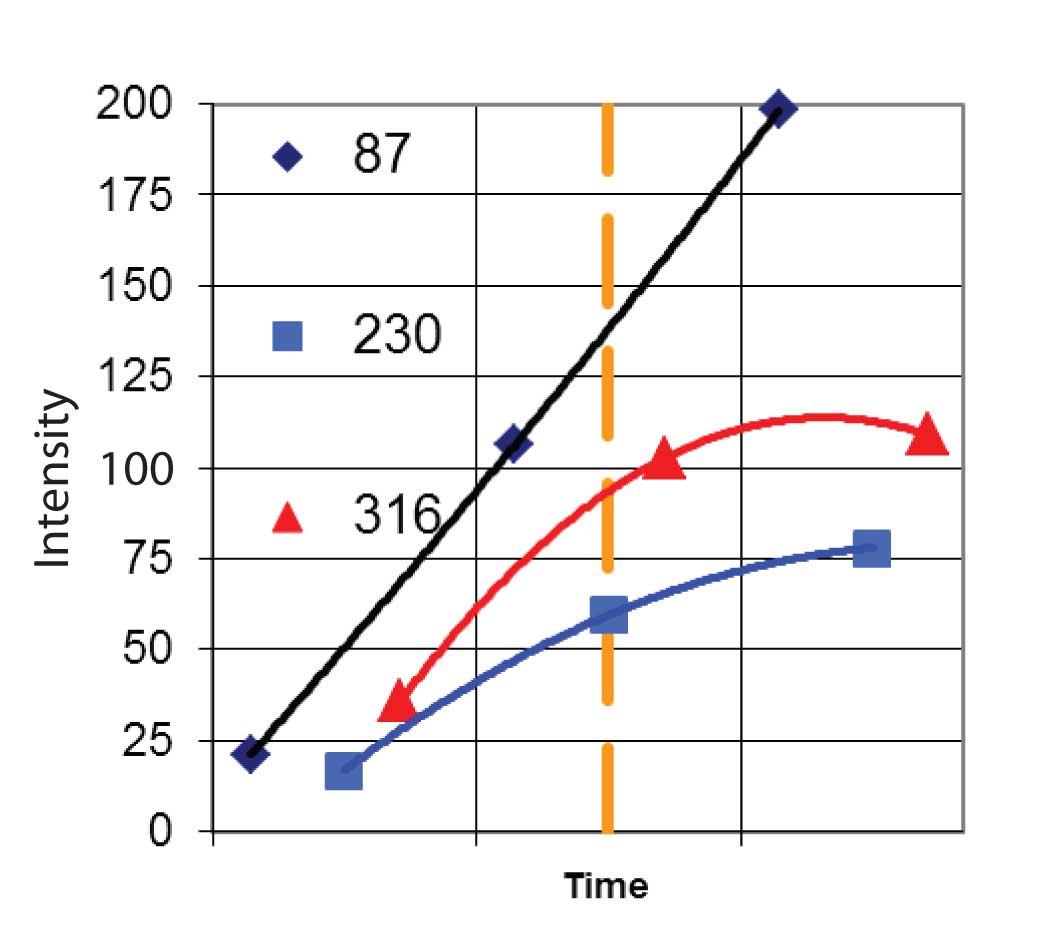
AMDIS goes through a number of steps to extract the mass spectral peaks belonging to the spectrum of a single component. The very first step is to analyze the noise level of the data. From this the program will determine how significant differences in signals are. The next step is to find the true intensity as a function of time for each EIC. For scanning instruments, the entire mass spectrum is recorded for each time step and assigned a single time. However, the mass spectrum was acquired over the entire time step, and there is a constant change in concentration as the component elutes from the column. To correct for this AMDIS first “deskews” the data. It does this by assigning the reported intensity for each ion at each time step to the correct time in which the data were taken. For example, suppose the spectrum was acquired from m/z 50 to m/z 450 and was acquired from low m/z value to high. In this case the ion at m/ z 100 would be assigned to a time equal to the spectrum acquisition start time plus ((100-50)/400) x spectrum interval. This would be done for the spectrum before, the current spectrum and the following spectrum. The three points would then be fitted to a parabola and the value of the parabola at the center of the current spectrum would be used as the intensity of the ion at that time. This process is repeated for each ion and for the TIC. The result is a new set of EIC profiles that now represent the true intensity of each ion. Figure 3 shows this for three ions (m/z 87, m/z 230, and m/z 316) for a hypothetical instrument that scans from low m/z value to high. Note that in the center time step, the raw data from the instrument gave the peak at m/z 87 and at m/z 316 almost the same intensity, but once the deskewing was done, the m/z 87 peak was significantly larger.

Figure 2: Individual EICs from the three components.
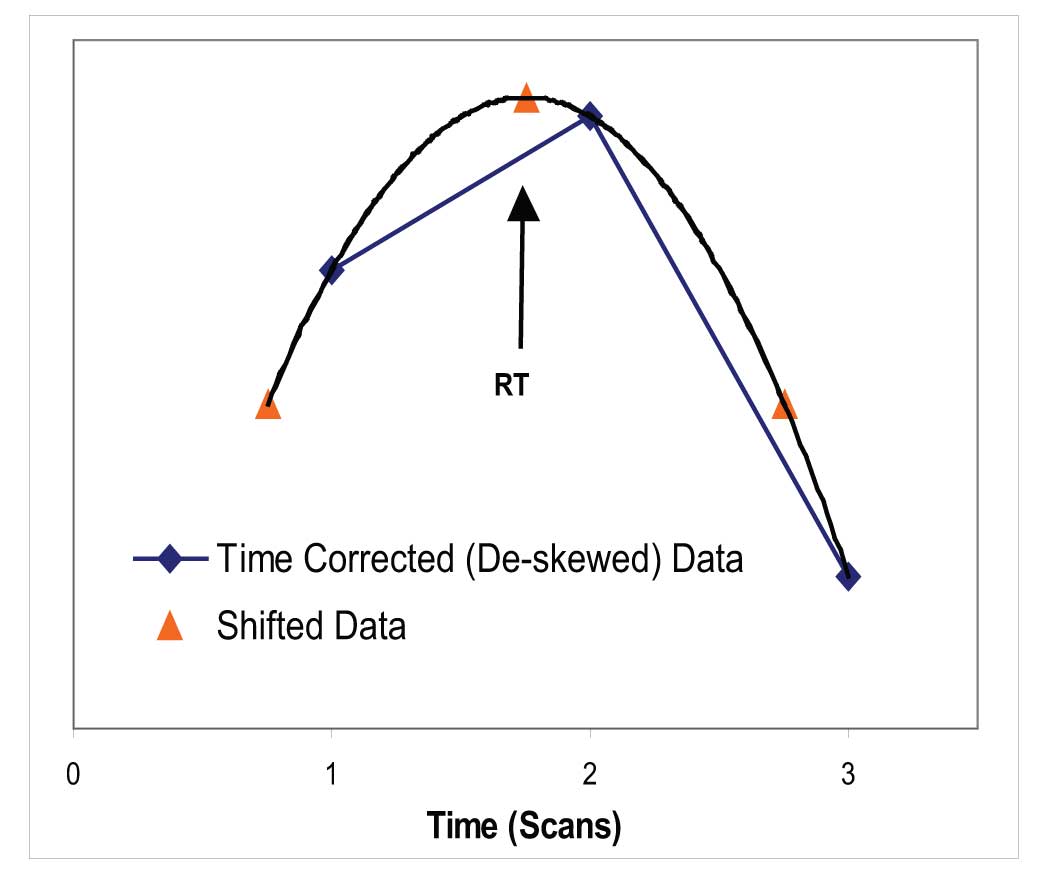
These deskewed intensities are then used to find all the maxima of the EICs (and the TIC). Once a maximum is identified, the exact time of the maximum is found by fitting another parabola to the intensity at the maximum and the intensity on each side (Figure 4). The maximum of the resulting parabola is then binned to 1/10th of the spectrum acquisition time. Once the time has been assigned to each maximum for each EIC, all ions that maximize in the same 1/10th of a acquisition time bin are collected and compared to the nearby bins.
The EICs that maximize are examined to determine the rate of rise to the maximum and fall after the maximum – the sharpness of the EIC peak – and the EIC peak with the highest degree of sharpness is used as a starting point for constructing a model of the time history of the component. The EICs with the maximum sharpness are more characteristic of the component than just the most abundant EICs. This is especially the case when there are a large number of common ions among components – for example when trimethylsilyl derivatized samples, such as shown in Figure 2, are analyzed, the low abundance ions (m/z 257, m/z 319 and m/z 387) are characteristic of each of the components, the most abundant ion at m/z 73 shows no indication of the multiple peaks.

Figure 3: Computation of Deskewed Ion Intensities.
In addition to finding the maximum and sharpness for each EIC, the program finds the width of each EIC peak. It does this by starting at the maximum and going forward and backward looking for the points where either the EIC goes to zero, or where it turns back up. When these points are found, the program defines these points as the extent of the component. The sharpest EIC (i.e., the one with the highest degree of sharpness) is then used to define the peak. Finally, all EIC peaks that maximize at the same time (± 1 bin) as the sharpest EIC peak and have a sharpness that is at least 75% of the sharpest EIC peak are averaged to create a final model for the shape of the component. These are the black lines shown in Figure 1.
The next step in extracting a spectrum is the least squares fitting of the model to the data for each EIC in the region of the model. In this case all EICs are examined, not just the ones that may have been used in the model building. This calculation takes into account the possibility of a sloping baseline and has the option of subtracting nearby models from the active model. Finally, the program compares the extracted shape of each EIC to the model.

Figure 4: Calculation of Location of Maximum for EIC.
The overlap of the shapes is used as a final parameter to determine if the ion is a part of the final extracted spectrum. Ions which have time history’s that are very different from the model peak are judged not be a part of the extracted spectrum. The result is a spectrum that is then compared to the target library.
The spectral matching in AMDIS is performed using a mass weighted dot product algorithm similar to the classic INCOS algorithm. In addition to this forward search, a reverse search match is performed and the final match factor is made up of 70% of the forward MF and 30% of the reverse MF. A number of corrections to the net match factor are also made for uncertainty in the extraction of the spectrum from the chromatogram. AMDIS can also penalize the match factor for mismatches in retention index (RI) from the library.
Parts 2–4 of this series will discuss setting up and using AMDIS and using AMDIS and the NIST search program together to build libraries. AMDIS is distributed with the NIST Mass Spectral Search Program.
A demo version with a limited library of the NIST MS Search Program may be downloaded. Click here>>
AMDIS may also be downloaded by itself. Click here>>
Gary Mallard was at NIST for 31 years and for the last 10 was Group Leader of the Standard Reference Data Group which was responsible for the NIST MS Database and the NIST WebBook. At NIST he was active in both writing the help files and part of the quality control for AMDIS. After leaving NIST he was Head of Laboratory for the Organization for the Prohibition of Chemical Weapons (OPCW) for 3 and a half years. He has developed a number of courses on AMDIS for training at the OPCW and continues to teach new inspectors for the Organization. He has also given AMDIS courses for instrument companies, the FDA, the CDC and at a number of laboratories in Europe, China and the United States. He is currently working on using AMDIS to develop databases of unidentified compounds in common matrices and improvements in the AMDIS software under a contract with NIST.
O. David Sparkman is currently an Adjunct Professor of Chemistry at the University of the Pacific in Stockton, California; Contractor to the National Institute of Standards and Technology Mass Spectrometry Data Center; President of ChemUserWorld.com; and a former American Chemical Society Instructor (1978–2006) and American Society for Mass Spectrometry Member-at-large for Education (2004–2006).
At the University of the Pacific, Prof. Sparkman teaches courses in mass spectrometry and analytical chemistry and manages the mass spectrometry facility. Over the past 28 years, he has developed and taught five different ACS courses in mass spectrometry; he holds positions on the Editorial Advisory Boards of the European Journal of Mass Spectrometry and the HD Science GC/MS Update – Part B; and is the Book Review Editor for the European Journal of Mass Spectrometry. He is the author of Mass Spectrometry Desk Reference (Global View Publishing: Pittsburgh, PA, 1st ed. 2000; 2nd ed. 2006). Prof. Sparkman is a member of the Editorial Boards of the John Wiley Encyclopedia of Environmental Analysis and Remediation and Encyclopedia of Analytical Chemistry, Editor of and a contributor to the Mass Spectrometry Section of the Encyclopedia of Analytical Chemistry, and a contributor to the Encyclopedia of Environmental Analysis and Remediation. Along with J. Throck Watson, he developed the Mass Spectral Interpretation Quick Reference Guide.
He also provides general consulting service in mass spectrometry for a number of instrument manufacturers, manufacturing companies, and government agencies.
