The Wiley Registry of Mass Spectral Data has contained a number of “single-peak” spectra such as those shown in Figure 1. Such spectra in an EI database used for the identification of unknowns based on their mass spectra are of no benefit. These spectra are included in the Registry because the Registry considers itself to be a compilation of all mass spectral data that has appeared in the literature. These spectra come about when a literature article reports that a compound’s elemental composition was established through the use of an accurate mass measurement on a mass spectrometer that has high resolving power. The Editors of the Registry will then create a mass spectrum with a nominal m/z -value peak that corresponds to the elemental composition's nominal mass. This peak becomes the base peak in such a mass spectrum. In many cases, the spectrum includes isotope peaks associated with this molecular ion peak. The intensity of these integer m/z -value isotope peaks have been calculated based on the theoretical values assigned in standard tables.
When a spectrum exhibiting what could be a molecular ion peak with a relative intensity greater than 10%, is searched using the National Institute of Standards and Technology (NIST) Mass Spectral (MS) Search Program against the Wiley Registry or the, increasing popular, combination of the Wiley Registry and the NIST EI Mass Spectral Database, the Wiley/NIST, a number of the spectra that have these single peaks at the same m/z as exhibited by the sample spectrum’s molecular ion peak can appear in the top 20 or so Hits. The reason this occurs is the way Match Factors are calculated by MS Search.
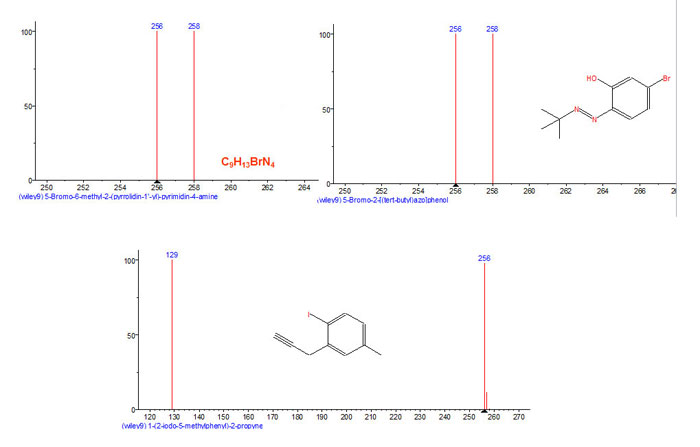
Figure 1: Three example of so-called “single peak spectra in the Wiley Registry of Mass Spectral Data.
The Match Factor is determined by using the m/z values and corresponding intensities in both the sample spectrum and the database spectrum. The lowest m/z value used is the higher of the lowest m/z value in the sample spectrum or the database spectrum where there is not a zero-intensity observed. This means that the lower limit used in the calculation of the Match Factor will be the m/z value of the single peak in a “single-peak” spectrum. Peaks at lower m/z values in the database spectrum will not be considered in the calculation of the Match Factor. This results in an artificially high Match Factor for the “single-peak” spectrum.
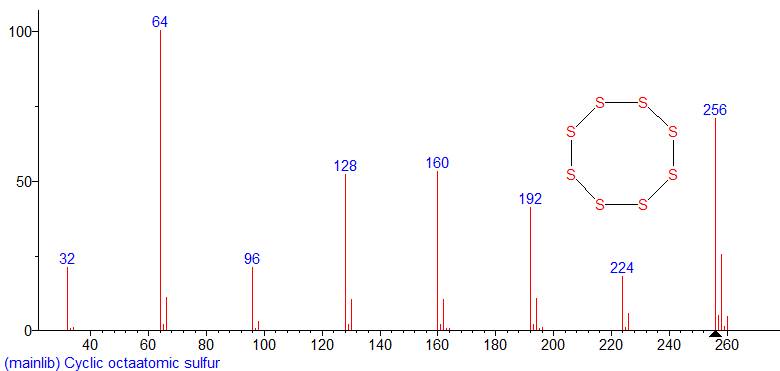
Figure 2: Mainlib EI mass spectrum for S8 from the NIST 11 Database.
A good example of this is when the mass spectrum of elemental sulfur (S8) is used as the sample spectrum (Figure 2). This spectrum was searched against the Wiley Registry. The top 20 Hits in the Hit List contain ten of these single-peak spectra (Figure 3). The Wiley Registry contains 11 spectra of S8. Only 10 of these spectra show up in the top 20 Hits. The 11th spectrum is Hit 44. The Match Factors for the first six Hits (all of which are spectra of S8) ranged from a high of 988 to a low of 873. The next four Hits (see Figure 4) are all single peak spectra of compounds that have a nominal mass of 256 Da but do not contain any atoms of sulfur. These Hits have Match Factors that range from 854 to 847. Note that some of these Hits have higher Reverse Match Factors than the Reverse Match Factors for the spectra of S8.
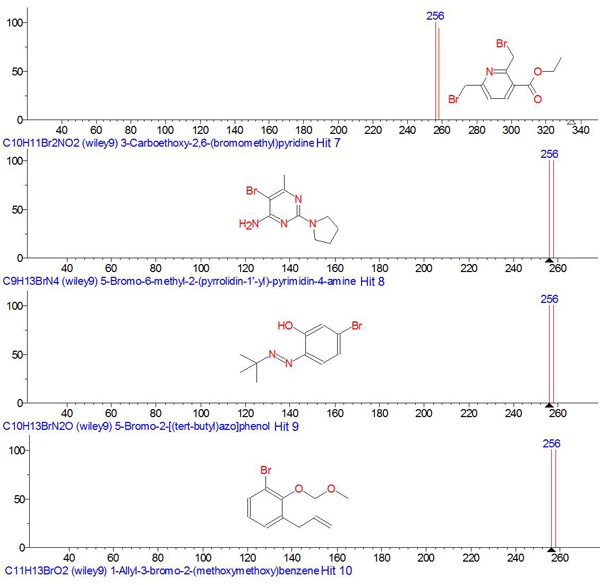
Figure 3: “Single-peak” spectra Hits 7, 8, 9, and 10 from a search of a mass spectrum of elemental sulfur (S8) against the Wiley Registry of Mass Spectral Data using the NIST MS Search program.
It should be obvious that Hits 7, 8, 9, and 10 are not reasonable answers and should be disregarded; however, such a result could create confusion with an inexperienced analyst. Generating these types of results should be avoided, if possible. These results only come about because of the way that the NIST MS Search Program calculates Match Factors and the fact the Wiley Registry has a significant number of “single-peak” spectra.
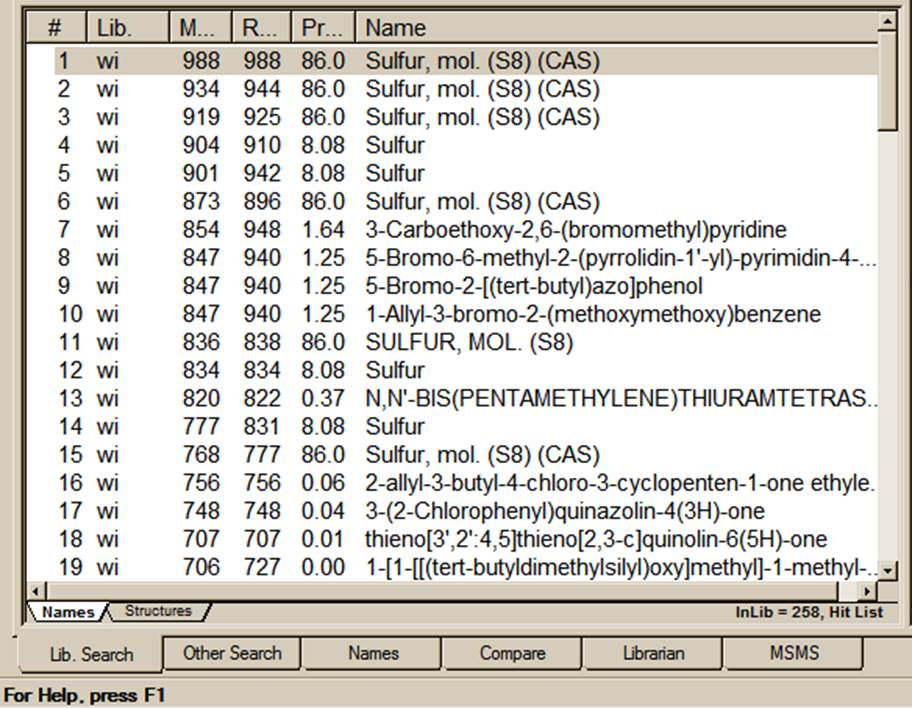
Figure 4: Hit List obtained using MS Search with Limits setting not used.
When working with Wiley Registry, it is advisable to employ the Limits setting in the Limits tab of the Library Search Options dialog box (Figure 5). The Library Search Options’ dialog box is displayed by selecting its icon on the button bar of the Lib Search tab view of the MS Search desktop or by selecting Options from the Main Menu Bar. From the Options menu, Library Search Options is selected to display the dialog box. Once the dialog box is displayed, click on the Limits tab. Check the Apply Limits check box (upper left) in the Limits tab view. Click on the dropdown arrow next to the entry field to the right of the Minimum m/z label. Select the never greater than choice. Enter the m/z value of the beginning of that used in the acquisition range in the box to the right. In the example shown in Figure 5, the value is set to 30. This says that when a Match Factor is calculated the Program will look at the lower m/z value for non-zero intensities in both the sample and database spectrum, but the lower limit will never be set to a value that is grater than 30. This means that peaks below the m/z value for the single peak in the sample spectrum that are in the database spectrum will be taken into consideration when the Match Factor is calculated.
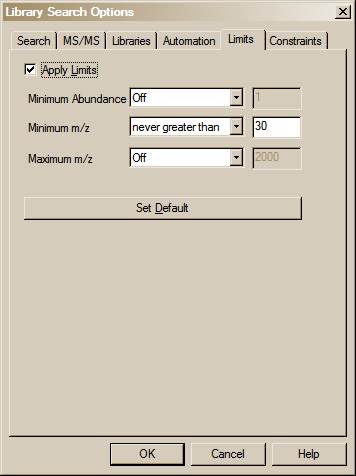
Figure 5: Limits tab view of the Library Search Options dialog box showing settings to be used with the Wiley Registry when the acquisition was begun at m/z 30.
Figure 6 is the Hit List obtained from the search of the sulfur spectrum against the Wiley Registry using the Limits option. All eleven spectra of S8 in the Wiley Registry are seen in the Hit List. Ten Wiley Registry spectra of S8 are in the top 11 Hits. Examination of the spectrum represented by Hit 9 shows that there is no molecular ion peak exhibited. When the spectrum is evaluated using the NIST MS Interpreter program (Figure 7), it is also seen that this is a reasonable spectrum for this structure. If the spectrum is indeed a spectrum of the specified compound, and not of elemental sulfur, it is just another one of those dilemmas that occur in EI mass spectrometry where two different compounds result in similar mass spectra.
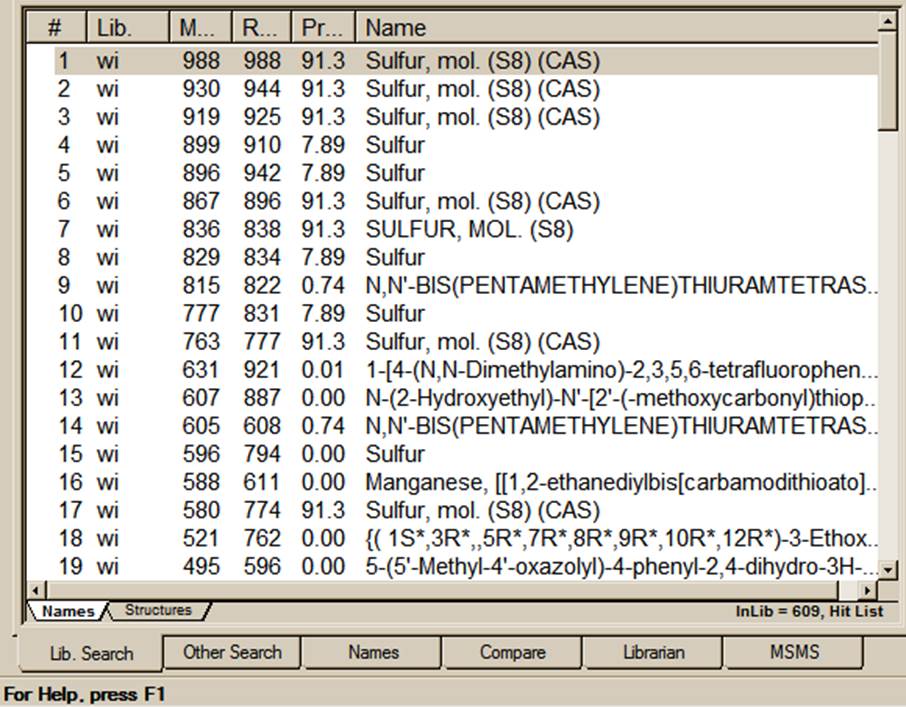
Figure 6: Hit List obtained using MS Search with Limits set to Not greater than 30.
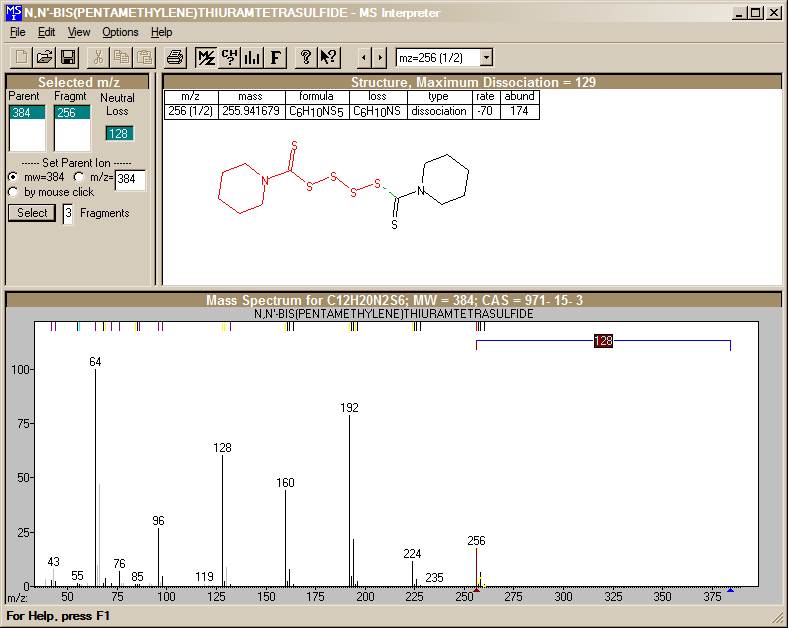
Figure 7: Mass spectrum of Hit 9 from Figure 6 illustrating a peak-pattern resembling that of the spectrum of S8 and a justification of the fragmentation.
The conclusion is that by using the Limits option, settable in the Library Search Options dialog box, when searching against the Wiley Registry and/or the combination of the Wiley Registry and NIST Mass Spectral Database a less confusing Hit List will be the result and make the result more understandable by the less experienced analyst.

